


|
Date of Prediction: 2008-11-04 Version:9
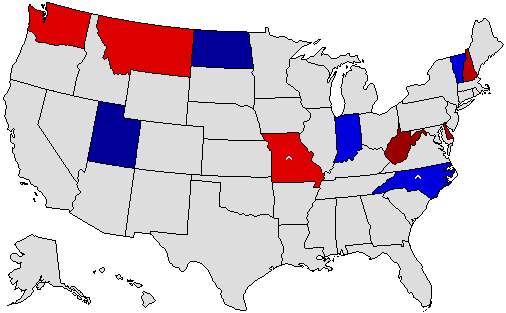
Prediction Map
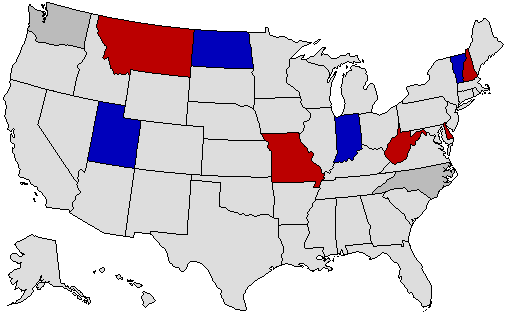
* = Pickup via defeat of incumbent; ^ = Pickup of an open seat Confidence Map
Prediction States Won
Confidence States Won
State Pick-ups
Prediction Score (max Score = 22)
Analysis
Final.
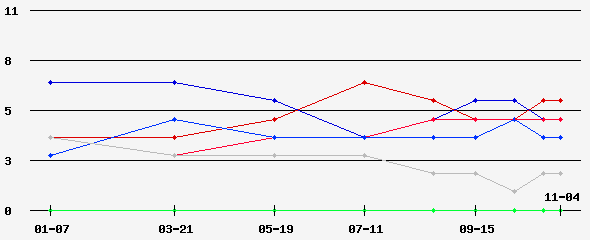
Prediction History
Comments History
- hide
Version: 8 Washington state is useless. Version: 7 Margins and confidence again. Version: 6 Changes in margins and confidence, and giving Washington state to the GOP. Dino Rossi is polling very well there. Version: 5 Giving North Carolina back to the Reps. Version: 4 Oy vey. Version: 3 Updates in confidence and margins based on recent trends and switching North Carolina to the Dems. Version: 2 Changing margins and confidence, but no change in winners. Version: 1 The 2008 presidential election, with either Barack Obama or Hillary Clinton at the top of the ticket...will have a big effect on the down the ballot races...governor included. Dino Rossi will win the office that was quite literally stolen from him four years ago, and voters in North Carolina will oust the Democratic regime for the first time in many years...change indeed.
Version History Member Comments User's Predictions
Links
|
||||||||||||||||||||||||||||||||||||||||||||||||||||||||||||||||||||||||||||||||||||||||||||||||||||||||||||||||||||||||||||||||||||||||||||||||||||||||||||||||||||||||||||||||||||||||||||||||||||||||||||||||||||||||||||||||||||||||||||||||||||||||||||||||||||||||||||||||||||||||||||||||||||||||||||||||||||||||||||||||||||||||||||||||||||||||||||||||||||||||||||||||||||||||||||||||||||||||||||||||||||||||||||||||||||||||||||||||||||||||||||||||||||||||||||||||||||||||||||||||||||||||||||||||||||||||||||||||||||||||||||||||||||||||||||
 2024 President
 2023 Governor
 2022 Senate
 2022 Governor
 2021 Governor
 2020 President
 2020 Senate
 2020 Governor
 2019 Governor
 2018 Senate
 2018 Governor
 2017 Governor
 2016 President
 2016 Senate
 2016 Governor
 2015 Governor
 2014 Senate
 2014 Governor
 2013 Governor
 2012 President
 2012 Senate
 2012 Governor
 2012 Rep Primary
 2011 Governor
 2010 Senate
 2010 Governor
 2009 Governor
 2008 President
 2008 Senate
 2008 Governor
 2008 Dem Primary
 2008 Rep Primary
 2007 Governor
 2006 U.S. Senate
 2006 Governor
 2004 President
Back to 2008 Gubernatorial Prediction Home - Predictions Home