


Note: The Google advertisement links below may advocate political positions that this site does not endorse.
|
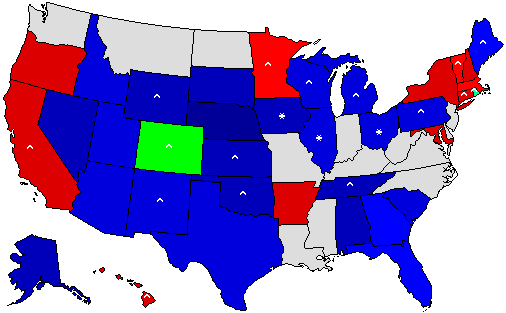
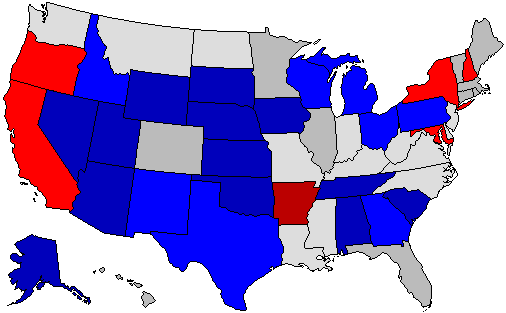
Date of Prediction: 2010-10-31 Version:10
Prediction Map
* = Pickup via defeat of incumbent; ^ = Pickup of an open seat Confidence Map
Prediction States Won
Confidence States Won
State Pick-ups
Prediction Score (max Score = 74)
Analysis
No Analysis Entered
Prediction History
Comments History
- hide
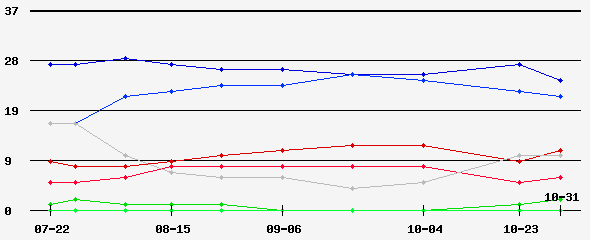
Version: 9 I'm shooting in the dark with these predictions, so don't be surprised if many of them are inaccurate. Version: 5 Sink leads Scott by 1.3%. Version: 3 I imputted gubernatorial polls on states whose primary winners are already known or are heavily favored. Oregon, Ohio, Maryland, and California are the closest contests. Other contests I have as tossups I have not analyzed yet. Version: 2 Just for shits and giggles, let's say Tancredo becomes Governor. Version: 1 Just a guess. I haven't developed a formula like I have for the Senate predictions.
Version History Member Comments User's Predictions
Links
|
||||||||||||||||||||||||||||||||||||||||||||||||||||||||||||||||||||||||||||||||||||||||||||||||||||||||||||||||||||||||||||||||||||||||||||||||||||||||||||||||||||||||||||||||||||||||||||||||||||||||||||||||||||||||||||||||||||||||||||||||||||||||||||||||||||||||||||||||||||||||||||||||||||||||||||||||||||||||||||||||||||||||||||||||||||||||||||||||||||||||||||||||||
 2022 Senate
 2022 Governor
 2020 President
 2020 Senate
 2016 President
 2016 Senate
 2016 Governor
 2015 Governor
 2014 Senate
 2014 Governor
 2010 Senate
 2010 Governor
 2009 Governor
 2008 President
 2008 Senate
 2008 Governor
 2008 Dem Primary
 2007 Governor
 2006 U.S. Senate
 2006 Governor


Back to 2010 Gubernatorial Prediction Home - Predictions Home
© Dave Leip's Atlas of U.S. Elections, LLC 2019 All Rights Reserved