PredictionsEndorse2010 Gubernatorial Predictions - AntonioV (D-CA) ResultsPolls
Note: The Google advertisement links below may advocate political positions that this site does not endorse.
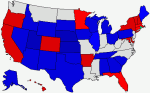
Date of Prediction: 2010-11-02 Version:10
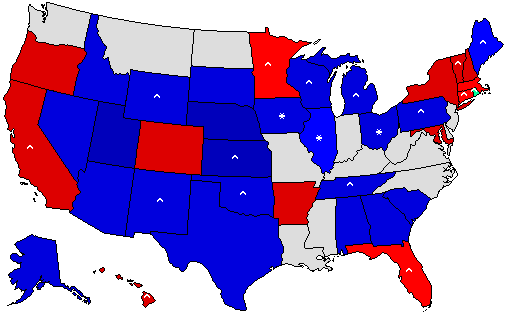
Prediction Map
AntonioV MapPrediction Key

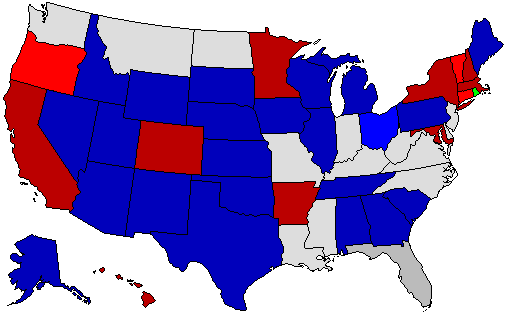
* = Pickup via defeat of incumbent; ^ = Pickup of an open seat

Confidence Map
AntonioV MapConfidence Key

Prediction States Won
19 |
37 |
37 |
Dem13
 
pie
Rep23
 
Ind1
 
Non0
 

Confidence States Won
19 |
37 |
37 |
Dem12
 
pie
Rep23
 
Ind1
 
Tos1
 
Non0
 

State Pick-ups

Gain Loss Hold Net Gain
Inc. Open Total Inc. Open Total Inc. Open Total
Dem0+6+6-3-9-12437-6
Rep+3+9+120-7-76511+5
Ind0+1+1000000+1


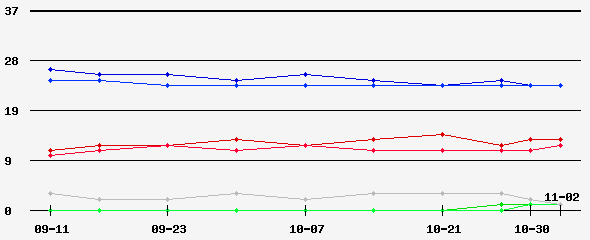
Prediction Score (max Score = 74)

ScoreState WinsState Percentages
593524
piepiepie

Analysis

Analysis based on 538.com's final forecast (http://elections.nytimes.com/2010/forecasts/governor).

Tossup means the frontrunner has less than 60% chances of winning. Lean means it has between 60% and 80%. Strong means it has over 80% chances of prevailing.


Prediction History
Prediction Graph


Comments History - hide

Version: 2

New fivethirtyeight.com forecast : seems like a Vermont poll suddenly flipped Vermont from Lean R to Lean D.


Version: 1

Prediction based on Fivethirtyeight.com's gubernatorial forecasts.


Version History


Member Comments
 By: AntonioV (D-CA) 2010-11-06 @ 17:20:53 prediction Map
Ok, so time for a restrospective comment (the merit/blame of course doesn't go to me, of course).

"I" was wrong for Florida (though this time it's not Nate's fault : he updated his forecasts just before the predictions closed so I couldn't update mine, plus the race was close so it still makes sense), and Illinois. But that's only the emerged part of the iceberg, because Nate got some races pretty bad. Three-way races were particularly bad : Cutler did a lot better in Maine, Caprio ended up at the third place, and Tancredo got 7% less in CO wereas Maes did almost twice as predicted. Add to that MN, CT and VT, where Dayton, Malloy and Shumlin were expected to win by big margins and eventually came close to losing. Oregon was also closer than expected, though it doesn't see unreasonable.

Most of those miscalls came from late surges that emerged in the very late race, but I remember Nate warned us that gubernatorial races usually end up closer than polls predicted, so that's fine. Still, if you add to that the fact most expected landslides were even bigger than projected (NY, AR, SD, NE, WY) and that gives me a pretty poor score...

 By: AntonioV (D-CA) 2010-11-10 @ 15:21:45 prediction Map
Aproximative calculation of my score...
Candidate ahead : 35/37
Correct percentage : 24/37
Global score : 59/74 (79.7%)

While I did far better than in 2008, I wasn't using fivethrityeight at the time. Whith less than 80%, this is the worst 538-based prediction I've ever made. I feel particularly frustrated for Florida (besides the fact Scott won, if at least I had updated my prediction in time, my score would have been 82.4%).


User's Predictions

Prediction Score States Percent Total Accuracy Ver #D Rank#Pred
P 2022 Senate 33/35 26/35 59/70 84.3% pie 6 0 69T305
P 2022 Governor 34/36 27/36 61/72 84.7% pie 6 0 51T272
P 2020 President 53/56 36/56 89/112 79.5% pie 13 5 434T684
P 2020 Senate 32/35 18/35 50/70 71.4% pie 8 3 274T423
P 2020 Governor 11/11 8/11 19/22 86.4% pie 1 5 10T293
P 2019 Governor 2/3 2/3 4/6 66.7% pie 1 4 35T192
P 2018 Senate 33/35 24/35 57/70 81.4% pie 14 0 24T483
P 2018 Governor 32/36 28/36 60/72 83.3% pie 7 2 18T372
P 2016 President 50/56 30/56 80/112 71.4% pie 18 0 246T678
P 2016 Senate 31/34 21/34 52/68 76.5% pie 18 0 35T362
P 2016 Governor 9/12 5/12 14/24 58.3% pie 6 0 67T279
P 2014 Senate 34/36 27/36 61/72 84.7% pie 8 0 13T382
P 2014 Governor 31/36 18/36 49/72 68.1% pie 5 0 56T300
P 2013 Governor 2/2 1/2 3/4 75.0% pie 2 24 17T153
P 2012 President 56/56 48/56 104/112 92.9% pie 15 0 13T760
P 2012 Senate 31/33 19/33 50/66 75.8% pie 11 0 111T343
P 2012 Governor 11/11 7/11 18/22 81.8% pie 2 31 24T228
P 2012 Rep Primary 44/52 23/52 67/104 64.4% pie 27 - 16T231
P 2010 Senate 34/37 28/37 62/74 83.8% pie 19 0 21T456
P 2010 Governor 35/37 24/37 59/74 79.7% pie 10 0 59T312
P 2009 Governor 1/2 0/2 1/4 25.0% pie 1 12 92T103
P 2008 President 54/56 45/56 99/112 88.4% pie 9 0 26T1,505
P 2008 Senate 33/33 27/33 60/66 90.9% pie 5 0 1T407
P 2008 Governor 10/11 4/11 14/22 63.6% pie 1 5 212T264
Aggregate Predictions 696/751 496/751 1192/1502 79.4% pie


Back to 2010 Gubernatorial Prediction Home - Predictions Home


Terms of Use - DCMA Policy - Privacy Policy and Cookies

© Dave Leip's Atlas of U.S. Elections, LLC 2019 All Rights Reserved