


|
Date of Prediction: 2010-11-01 Version:20
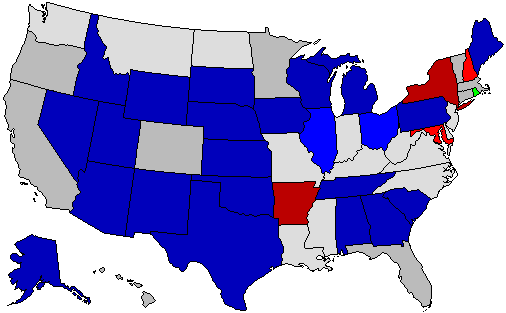
Prediction Map
* = Pickup via defeat of incumbent; ^ = Pickup of an open seat Confidence Map
Prediction States Won
Confidence States Won
State Pick-ups
Prediction Score (max Score = 74)
Analysis
The hardest gubernatorial races to handicap are the threeways in CO and MA. The GOP would win both without the third party candidates. As it is, I am splitting my losses and giving CO to the Dems and MA to the GOP. For the other tossups, recent polling suggests wins for the GOP in CT and OR. The Dems seem to lead in HI, CA, and VT. Polling in FL is all over the place, but because of the early voting numbers, I tipped it to Scott. And in MN, the race is razor tight, but I tipped it to the Dems bc MN never fails to disappoint me. Ehrlich may be doing better than polls show in MD, but if they are right, he's in trouble. The only other race that bears mentioning is OH, where if John Kasich doesn't win and by a pretty healthy margin, I will eat my shoe. Any polls showing otherwise are just flat wrong.
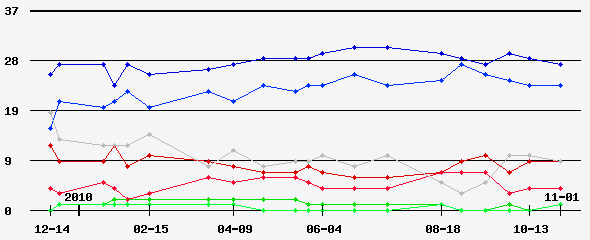
Prediction History
Comments History
- show
Version History Member Comments User's Predictions
Links
|
||||||||||||||||||||||||||||||||||||||||||||||||||||||||||||||||||||||||||||||||||||||||||||||||||||||||||||||||||||||||||||||||||||||||||||||||||||||||||||||||||||||||||||||||||||||||||||||||||||||||||||||||||||||||||||||||||||||||||||||||||||||||||||||||||||||||||||||||||||||||||||||||||||||||||||||||||||||||||||||||||||||||||||||||||||||||||||||||||||||||||||||||||||||||||||||||||||||||||||||||||||||||||||||||||||||||||||||||||||||||||||||||||||||||||||||||||||||||||||||||||||||||||||||||||||||||||||||||||||||||||||||||||||||||||||||||||

 2024 President
 2023 Governor
 2022 Senate
 2022 Governor
 2021 Governor
 2020 President
 2020 Senate
 2020 Governor
 2019 Governor
 2018 Senate
 2018 Governor
 2017 Governor
 2016 President
 2016 Senate
 2016 Governor
 2015 Governor
 2014 Senate
 2014 Governor
 2013 Governor
 2012 President
 2012 Senate
 2012 Governor
 2012 Rep Primary
 2011 Governor
 2010 Senate
 2010 Governor
 2009 Governor
 2008 President
 2008 Senate
 2008 Governor
 2008 Dem Primary
 2008 Rep Primary
 2007 Governor
 2006 U.S. Senate
 2006 Governor
 2004 President


Back to 2010 Gubernatorial Prediction Home - Predictions Home