


Note: The Google advertisement links below may advocate political positions that this site does not endorse.
|
Date of Prediction: 2012-11-02 Version:11
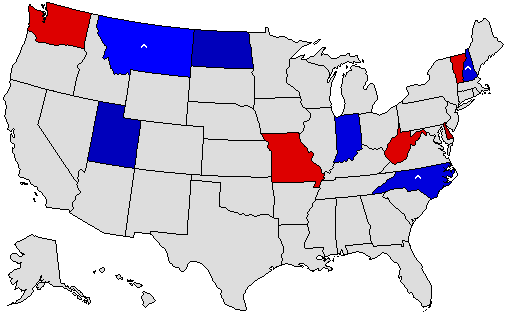
Prediction Map
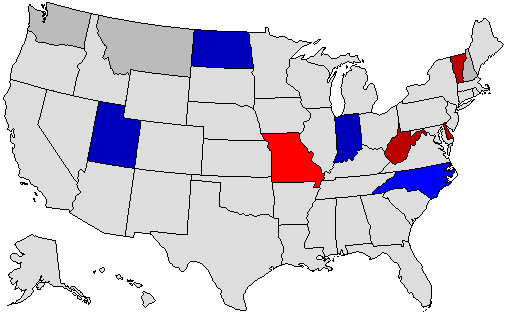
* = Pickup via defeat of incumbent; ^ = Pickup of an open seat Confidence Map
Prediction States Won
Confidence States Won
State Pick-ups
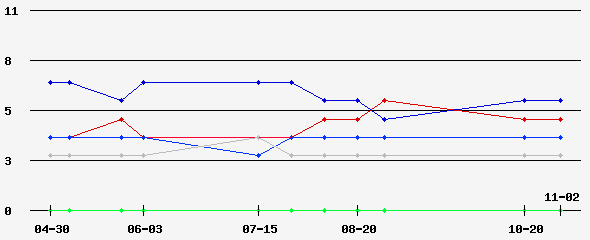
Prediction Score (max Score = 8)
Analysis
Update 11: Montana from D >40 to R >40.
Prediction History
Comments History
- hide
Version: 10 Update 11: New Hampshire from D >40% to R >50%. Version: 9 Update 10: Version: 8 Update 9: Washington from D >40% to D >50%. Version: 7 Update 8: Washington from R >40% to D >40%. Version: 6 Update 6: North Carolina from Tossup to Lean. Version: 5 Update 5: North Carolina from Lean to Tossup. Version: 4 Update 4: Washington from D >40% to R >40%. Version: 3 Update 3: Washington from R >40% to D >40%. Version: 2 Update 2: West Virginia from Lean to Strong. Version: 1 GOP picks up Washington, Montana, North Carolina and New Hampshire.
Version History Member Comments User's Predictions
Links
|
||||||||||||||||||||||||||||||||||||||||||||||||||||||||||||||||||||||||||||||||||||||||||||||||||||||||||||||||||||||||||||||||||||||||||||||||||||||||||||||||||||||||||||||||||||||||||||||||||||||||||||||||||||||||||||||||||||||||||||||||||||||||||||||||||||
 2016 President
 2016 Senate
 2016 Governor
 2014 Senate
 2014 Governor
 2013 Governor
 2012 President
 2012 Senate
 2012 Governor
 2012 Rep Primary


Back to 2012 Gubernatorial Prediction Home - Predictions Home
© Dave Leip's Atlas of U.S. Elections, LLC 2019 All Rights Reserved