


|
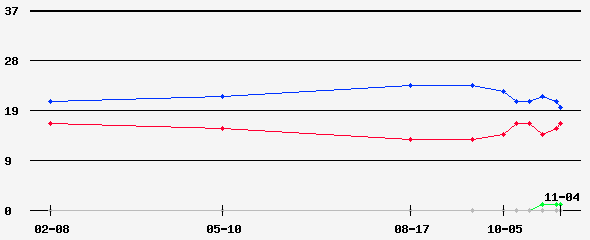
Date of Prediction: 2014-11-04 Version:10
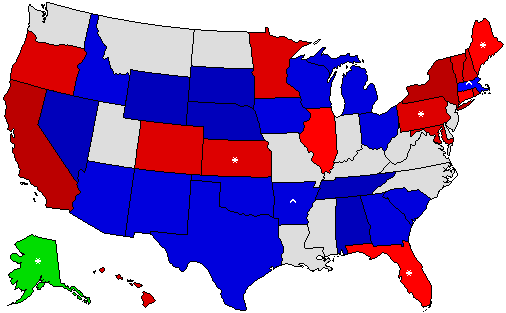
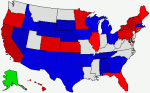
Prediction Map
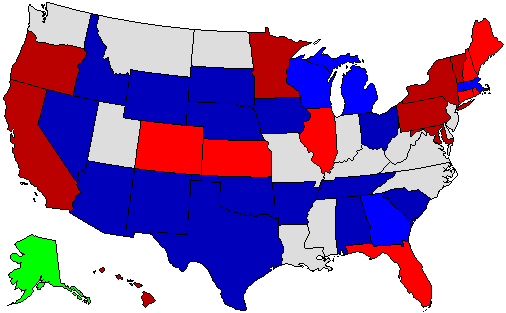
* = Pickup via defeat of incumbent; ^ = Pickup of an open seat Confidence Map
Prediction States Won
Confidence States Won
State Pick-ups
Prediction Score (max Score = 72)
Analysis
My rating system is based on data compiled from 15 sources and uses a scale of 3 categories (Safe/Likely/Weak) for each party (Republican/Democrat/Independent). The rating is based on a numerical score where a likelihood of victory less than 67% is Weak, 67-83% is Likely, and greater than 83% is Safe. To fit within this site's rating system, the Likely category is split in half so that a likelihood of 75% or more is "Strong" and less than 75% is "Lean." No races are rated as Toss Up.
Prediction History
Comments History
- hide
Version: 9 My rating system is based on data compiled from 15 sources and uses a scale of 3 categories (Safe/Likely/Weak) for each party (Republican/Democrat/Independent). The rating is based on a numerical score where a likelihood of victory less than 67% is Weak, 67-83% is Likely, and greater than 83% is Safe. To fit within this site's rating system, the Likely category is split in half so that a likelihood of 75% or more is "Strong" and less than 75% is "Lean." No races are rated as Toss Up. Version: 8 My rating system is based on data compiled from 13 sources and uses a scale of 3 categories (Safe/Likely/Weak) for each party (Republican/Democrat/Independent). The rating is based on a numerical score where a likelihood of victory less than 67% is Weak, 67-83% is Likely, and greater than 83% is Safe. To fit within this site's rating system, the Likely category is split in half so that a likelihood of 75% or more is "Strong" and less than 75% is "Lean." No races are rated as Toss Up. Version: 7 My rating system is based on data compiled from 13 sources and uses a scale of 3 categories (Safe/Likely/Weak) for each party (Republican/Democrat/Independent). The rating is based on a numerical score where a likelihood of victory less than 67% is Weak, 67-83% is Likely, and greater than 83% is Safe. To fit within this site's rating system, the Likely category is split in half so that a likelihood of 75% or more is "Strong" and less than 75% is "Lean." No races are rated as Toss Up. Version: 6 My rating system is based on data compiled from 11 sources and uses a scale of 3 categories (Safe/Likely/Weak) for each party (Republican/Democrat/Independent). The rating is based on a numerical score where a likelihood of victory less than 67% is Weak, 67-83% is Likely, and greater than 83% is Safe. To fit within this site's rating system, the Likely category is split in half so that a likelihood of 75% or more is "Strong" and less than 75% is "Lean." No races are rated as Toss Up. Version: 5 My rating system is based on data compiled from 12 sources and uses a scale of 3 categories (Safe/Likely/Weak) for each party (Republican/Democrat/Independent). The rating is based on a numerical score where a likelihood of victory less than 67% is Weak, 67-83% is Likely, and greater than 83% is Safe. To fit within this site's rating system, the Likely category is split in half so that a likelihood of 75% or more is "Strong" and less than 75% is "Lean." No races are rated as Toss Up. Version: 4 My rating system is based on data compiled from 10 sources and uses a scale of 3 categories (Safe/Likely/Weak) for each party (Republican/Democrat/Independent). The rating is based on a numerical score where a likelihood of victory less than 67% is Weak, 67-83% is Likely, and greater than 83% is Safe. To fit within this site's rating system, the Likely category is split in half so that a likelihood of 75% or more is "Strong" and less than 75% is "Lean." No races are rated as Toss Up. Version: 3 August 2014 Update: Colorado from Strong D to Lean D, Connecticut from Lean D to Lean R, Florida from Lean D to Lean R, Georgia from Strong R to Lean R, Hawaii from Strong D to Lean D, Kansas from Strong R to Lean R, Wisconsin from Strong R to Lean R<br /> <br /> May 2014 Update: Illinois from Lean D to Lean R, Pennsylvania from Lean D to Strong D Version: 2 Illinois Lean D to Lean R, Pennsylvania Lean D to Strong D Version: 1 My election assessment method doesn't map exactly to the terminology used on this site. We rate races as "Safe," "Likely," and "Weak" for one party or another (no toss ups). I merged Safe and Likely into strong confidence and classified Weak as lean. I set all the percentages as >50% because we don't track that in our method.
Version History Member Comments
User's Predictions
User Info
Links
|
|||||||||||||||||||||||||||||||||||||||||||||||||||||||||||||||||||||||||||||||||||||||||||||||||||||||||||||||||||||||||||||||||||||||||||||||||||||||||||||||||||||||||||||||||||||||||||||||||||||||||||||||
 2018 Senate
 2018 Governor
 2015 Governor
 2014 Senate
 2014 Governor


Back to 2014 Gubernatorial Prediction Home - Predictions Home