


|
Date of Prediction: 2018-11-06 Version:5
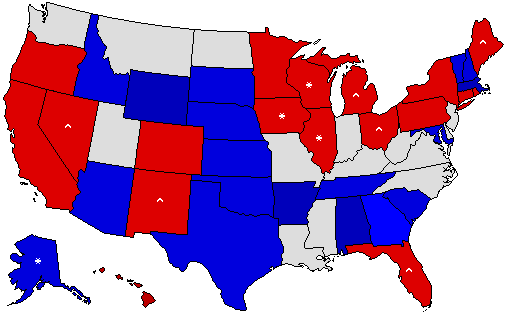
Prediction Map
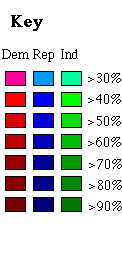
* = Pickup via defeat of incumbent; ^ = Pickup of an open seat Confidence Map
Prediction States Won
Confidence States Won
State Pick-ups
Prediction Score (max Score = 72)
Analysis
11/6/18: Final map. I agree with the Atlas consensus here as well, Dems should pick up 8-9 governorships. While Dems are slight favorites in Iowa, GOP in Kansas, this could easily reverse. As for Georgia, the state should go to a runoff (as a Democrat, I am not optimistic about runoffs in the South). But look for a possible surprise in New England.
Prediction History

Comments History
- hide
Version: 4 10/30/18: Maybe I should shift Ohio? Version: 3 11/23/18: Governorships looking better for Democrats. Florida seems safe, and Alaska is now a tossup. Dems will probably beat Walker in Wisconsin.<br /> Version: 2 11/16/18: Three weeks out, Dems poised to pick up +/- six governorships. Wisconsin and Nevada will be very close, and Georgia may go to a runoff! Version: 1 7/31: I am confident about at least four Democratic pickups--Me, Mich, Ill, NM.
Version History Member Comments User's Predictions
User Info
Links
|
||||||||||||||||||||||||||||||||||||||||||||||||||||||||||||||||||||||||||||||||||||||||||||||||||||||||||||||||||||||||||||||||||||||||||||||||||||||||||||||||||||||||||||||||||||||||||||||||||||||||||||||||||||||||||||||||||||||||||||||||||||||||||||||||||||||||||||||||||||||||||||||||||||||||||||||||||||||||||||||||||||||||||||||||||||||||||||||||||||||||||||||||||||||||||||||||||||||||||||||||||||||||||||||||
 2022 Senate
 2022 Governor
 2020 President
 2020 Senate
 2020 Governor
 2018 Senate
 2018 Governor
 2016 President
 2016 Senate
 2016 Governor
 2014 Senate
 2014 Governor
 2012 President
 2012 Senate
 2012 Governor
 2010 Senate
 2010 Governor
 2008 President
 2008 Senate
 2008 Dem Primary
 2008 Rep Primary
 2006 U.S. Senate
 2006 Governor
 2004 President


Back to 2018 Gubernatorial Prediction Home - Predictions Home