


|
Date of Prediction: 2022-11-07 Version:6
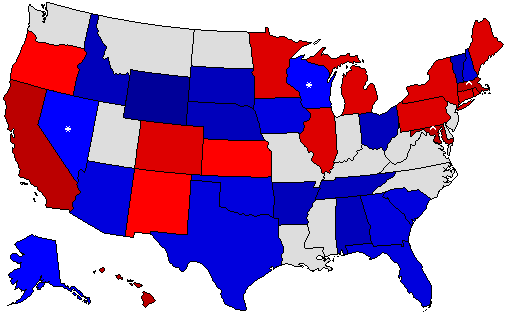
Prediction Map
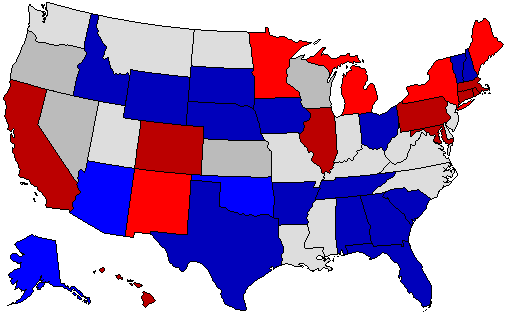
* = Pickup via defeat of incumbent; ^ = Pickup of an open seat Confidence Map
Prediction States Won
Confidence States Won
State Pick-ups
Analysis
A few updates that are encouraging for either side tomorrow, but the core, extraordinarily depressing fact remains that a number of genuinely deranged conspiracy theorists could easily end up elected to some key governorships, and the though of what they will likely try to do to our democracy if they take power absolutely horrifies me. My home state of Pennsylvania stands out as one of the very few places going against this trend, which is some degree of comfort, but things are looking very, very bad for the country as a whole.
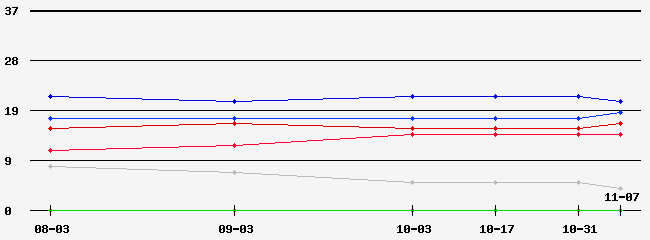
Prediction History
Comments History
- hide
Version: 5 There are some key competitive states that haven't had a single poll in over a month, and even in the states that we have seen polling from, a wildly disproportionate share is from partisan pollsters and/or pollsters with no track record. Consider most of these to be nothing more than uneducated guesses at this point. Version: 4 Hardly any changes on this map, with only Georgia switching to Strong Republican from Lean Republican. There has been some very strange polling out of Oklahoma with the Democratic candidate leading lately that has me keeping my eye on that state, but as of yet I don't feel it is advisable to make a category change. Next map is planned for October 31st, by which point I'm hoping I will have more clarity on things. Version: 3 A few important changes favoring both parties in the confidence categories, but the only lead change here is in Oregon, where the bizarre three-way race happening there is currently unfolding in a way that looks to be favoring the Republican candidate. Next update is planned for two weeks from now. Version: 2 I've only made two significant changes on this map. First, I've swapped Arizona from a narrow Republican win to a narrow Democratic win, as I'm feeling increasingly confident about how Kelly will do in the Senate race there, and I think a strong performance by him in that race could make the difference for Hobbs in the gubernatorial contest. Second, I have swapped Pennsylvania from Tossup to Lean Democratic, as Shapiro seems to be fairly clearly solidifying his position in the polling and as Mastriano's campaign is failing to make much of any impression outside of those who are already reliable hard-right voters. Next update will likely be in early October. Version: 1 I do not feel I have a great read on a lot of these races, so significantly more tossups and leans than usual for now. Still, wanted to make a map since I decided to do a Senate one. The gubernatorial races could be an absolute catastrophe for Democrats if things go poorly, but right now it looks like they can hopefully keep the losses relatively contained.
Version History Member Comments User's Predictions
Links
|
|||||||||||||||||||||||||||||||||||||||||||||||||||||||||||||||||||||||||||||||||||||||||||||||||||||||||||||||||||||||||||||||||||||||||||||||||||||||||||||||||||||||||||||||||||||||||||||||||||||||||||||||||||||||||||||||||||||||||||||||||||||||||||||||||||||||||||||||||||||||||||||||||||||||||||||||||||||||||||||
 2024 President
 2022 Senate
 2022 Governor
 2020 President
 2018 Senate
 2018 Governor
 2016 President
 2014 Senate
 2014 Governor
 2012 President
 2012 Senate
 2012 Rep Primary
 2010 Senate
 2010 Governor
 2008 President
 2008 Dem Primary


Back to 2022 Gubernatorial Prediction Home - Predictions Home