


Note: The Google advertisement links below may advocate political positions that this site does not endorse.
|
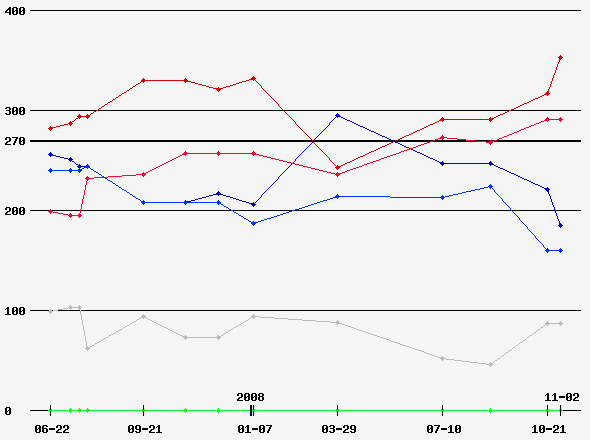
Date of Prediction: 2008-11-04 Version:14
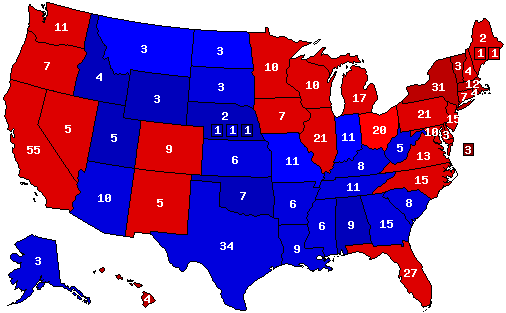
Prediction Map
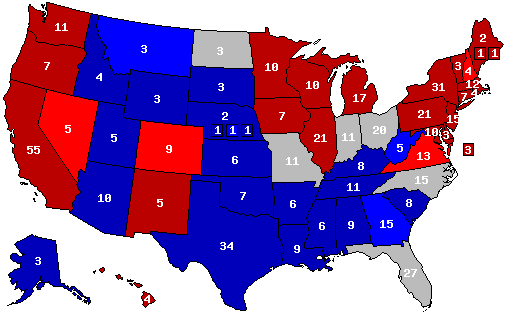
Confidence Map
Prediction States Won
Confidence States Won
State Pick-ups
Prediction Score (max Score = 112)
Analysis
My final, final Electoral College map for the 2008 Presidential Election between Barack Obama and John McCain. The only modification in this map is the moving of Missouri back into the McCain column and Florida and Ohio into the Obama column. With these final changes, Obama's EV total moves up to 353 whilst McCain's drops down to 185.
Prediction History
Comments History
- show
Version History Member Comments User's Predictions
Links
|
||||||||||||||||||||||||||||||||||||||||||||||||||||||||||||||||||||||||||||||||||||||||||||||||||||||||||||||||||||||||||||||||||||||||||||||||||||||||||||||||||||||||||||||||||||||||||||||||||||
 2008 President
 2008 Senate
 2008 Governor
 2008 Dem Primary
 2008 Rep Primary
 2007 Governor
Back to 2008 Presidential Prediction Home - Predictions Home
© Dave Leip's Atlas of U.S. Elections, LLC 2019 All Rights Reserved