


|
Date of Prediction: 2008-11-03 Version:19
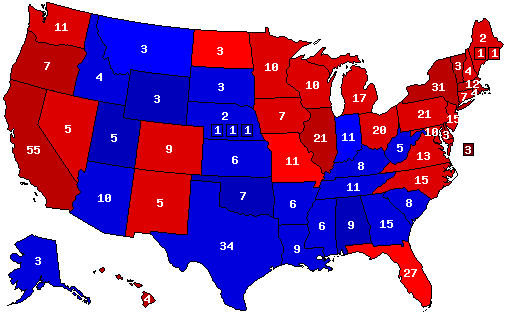
Prediction Map
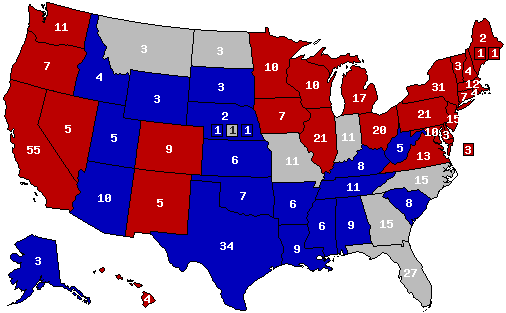
Confidence Map
Prediction States Won
Confidence States Won
State Pick-ups
Prediction Score (max Score = 112)
Analysis
I've analyzed all of the data, crunched all of the numbers, reviewed the trends, and looked at the get out the vote operations and voter enthusiasm, and this is the most likely result I can come up with. No more lean states at this point: I've decided that either I'm certain on a state or I'm not, no in-betweens. Missouri remains the most flippable state, I just can't get a good read of what's happening there. Regardless, unless the polls are wrong on a historic level, Barack Obama will be our 44th President. I expect him to have around a 9% lead over McCain in the popular vote. In a high-turnout landslide scenario, I think he could actually pull off upset victories in Georgia and Nebraska's second congressional district.
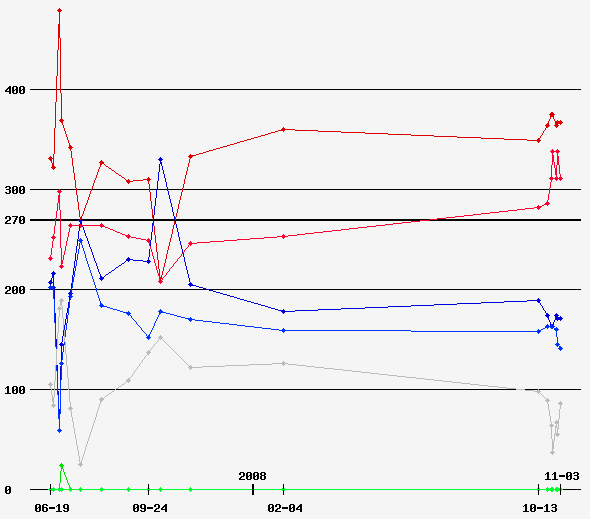
Prediction History
Comments History
- show
Version History Member Comments User's Predictions
Links
|
||||||||||||||||||||||||||||||||||||||||||||||||||||||||||||||||||||||||||||||||||||||||||||||||||||||||||||||||||||||||||||||||||||||||||||||||||||||||||||||||||||||||||||||||||||||||||||||||||||||||||||||||||||||||||||||||||||||||||||||||||||||||||||||||||||||||||||||||||||||||||||||||||||||||||||||||||
 2024 President
 2022 Senate
 2022 Governor
 2020 President
 2018 Senate
 2018 Governor
 2016 President
 2014 Senate
 2014 Governor
 2012 President
 2012 Senate
 2012 Rep Primary
 2010 Senate
 2010 Governor
 2008 President
 2008 Dem Primary
Back to 2008 Presidential Prediction Home - Predictions Home