PredictionsMock2008 Presidential Predictions - wingindy (I-IN) ResultsPolls
Note: The Google advertisement links below may advocate political positions that this site does not endorse.
Date of Prediction: 2008-11-03 Version:22

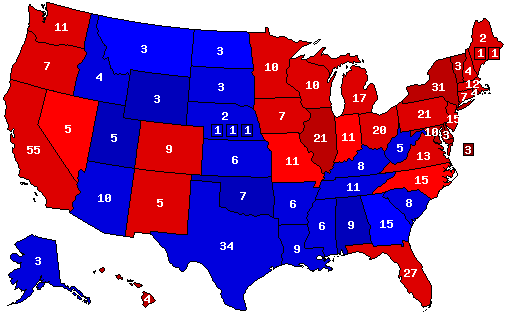
Prediction Map
wingindy MapPrediction Key

Confidence Map
wingindy MapConfidence Key

Prediction States Won
270 |
538 |
pie
Dem375
 
Rep163
 
Ind0


Confidence States Won
270 |
538 |
pie
Dem311
 
Rep142
 
Ind0
 
Tos85
 

State Pick-ups

Gain Loss Hold Net Gain
ST CD EV ST CD EV ST CD EV
Dem+100+123000202252+123
Rep000-100-123213163-123
Ind0000000000


Prediction Score (max Score = 112)

ScoreState WinsState PercentagesCD WinsCD Percentages
98504143
piepiepiepiepie

Analysis

Obama-Biden 51.5%
McCain-Palin 46%
Nader-Gonzolez 1%
Barr 1%
Other 0.5%

Likely my final map. Closest states: Missouri, Indiana, & Montana.

Last minute GOP ads claiming Obama wants to bankrupt coal companies has small effect in IN, PA & OH. PA remains out of reach for McCain. Indiana may not be called until 10:00 p.m., by which time projected Obama wins in PA, NC, & VA portend national outcome.

Dems +8 Senate seats, with a runoff to come in GA. Dems. +28 House seats.

Jesse Jackson, Jr. will be appointed to replace Obama in the Senate. Beau Biden will replace his father. Obama will name Dick Lugar as Secretary of State. Within six months, McCain will announce that he does not intend to run for re-election in 2010.


Prediction History
Prediction Graph


Comments History - show

Version History


Member Comments
 By: wingindy (I-IN) 2008-11-03 @ 19:14:39
The last of the early voters stood in line wrapped around the Indianapolis/Marion County City-County Building at noon today. The GOP is laying it on heavy, running Reverend Wright ads and claiming that Obama would bankrupt the coal industry. I feel much as I did on the day before the primary: afraid that Obama would loose (in Indiana), but unable to do anything bu predict victory.

My confidence map is not appearing, but tossups are, in order of reverse order of difficulty for Obama, are Florida, North Carolina, Missouri, Indiana, Montana, Georgia, and North Dakota. I have Colorado, Virginia, and Nevada (I think) as lean Obama, and , Arizona, NE-02, W. Virginia and NE-01 as lean McCain.

Indiana to early to call for at least an hour after poll closing will give us a hint. Viginia will be called for Obama before Indiana, IMHO, and will therefore be the 'tipping point' state.
prediction Map

 By: BushCountry (I-IN) 2008-11-04 @ 02:40:51
I actually think this is a good map, and it could come true. prediction Map

 By: wingindy (I-IN) 2008-11-04 @ 03:03:14
Oh yeah, and Ohio (how could I forget) is the tossup I have tilting most heavily towards Obama.

This prediction seems not to have registered.
prediction Map

 By: demboy73 (D-AUS) 2008-11-04 @ 08:32:51
Best of luck today Win - bring over Indiana would you!
:)

prediction Map

 By: demboy73 (D-AUS) 2008-11-04 @ 08:33:38
gosh darn it!
I can't believe you've only done 22 versions!
Well restrained!
I thought you would be heaps more.

prediction Map

 By: demboy73 (D-AUS) 2008-11-04 @ 08:34:48
Maybe Obama should employ Sarah Palin in homeland security for her folksiness & skill with a gun!
Oh & she lives nextdoor to Russia.
I must say strange as it is I will miss her on the campaign trail, especially Tina Fey.

prediction Map

 By: tmthforu94 (D-MO) 2008-11-06 @ 15:45:23
Wow.
Great map suprisiingly. The only state you got wrong was MO, and that was a very close race.
Good job
prediction Map

 By: wingindy (I-IN) 2008-11-06 @ 23:33:36
Thanks! How did it happen in IN? Check out: http://www.blueindiana.net/showDiary.do;jsessionid=C00B4DD6137FF40296E6DC08D0DFEB85?diaryId=3433

Don't count MO out yet! I do think Obama will be allocated NE-02 - demboy hit it there, and perhaps a couple others.

I was off on percentages in NV, CT, CA (I can't believe it - I actually listened to Geceres on CA being under 60%) & HI. I was one point off on Obama's percentage of the vote, and way high on the third party vote. Lugar won't be SOS - my current pick is Richard Holbrooke. He's a genius, IMHO. Jackson, Jr. may nopt be the strongest choice. Tammy Duckworth, a protege of Durbin's has been mentioned. Rep. Jan Schakowsky from Evanston is my pick of the day.
prediction Map

 By: DasKaek (D-IN) 2008-11-07 @ 13:42:56
Thanks for the comment. It's not so much that I didn't have faith in the Indiana campaign; more like I didn't have faith in this state to flip. Fortunately, I was wrong. I still can't believe this state went for Obama. And I am in the liberal bastion of Bloomington.

I wish your prediction had been 100% correct. I'd love to have seen Montana flip.
prediction Map

 By: wingindy (I-IN) 2008-11-07 @ 14:18:53
Its not to late. I find it amazing that with all the talk and info out there on the number of absentees, early votes and provisionals out there to be counted in the Alaska Senate race and in NE-02, and the recount process in the MN Senate race, I have not heard one single solitary word spoken of the status of yet to be called Missouri. 6,000 votes? That's like .02% of the vote. How many absentee and early votes have not been counted?

On Indiana: still sinking in. I have been freed from my long political isolation, which I first became aware of in my 5th grade class mock election in 1976, in which I was one of four that voted for Carter - in an election Carter won! I was amazed at the number of people I had asumed were Repubs. I saw out at Obama rallies, etc. Are you a student?
prediction Map

 By: tmthforu94 (D-MO) 2008-11-07 @ 16:45:11
Nope
Clay
Around Terre Haute
prediction Map

 By: wingindy (I-IN) 2008-11-07 @ 17:46:10
Omaha called for Obama:

http://www.omaha.com/index.php?u_page=2835&u_sid=10481441

Did ANYONE predict MO GOP, IN Dem. AND NE-2 Dem.??? I doubt it, but will anxiously await ratings to pull these predictions from the depths of Liepworld.
prediction Map

 By: wingindy (I-IN) 2008-11-07 @ 17:48:53
Ahh, I've been camping at Shakamak SP a few times. Nice Park.prediction Map

 By: wingindy (I-IN) 2008-11-07 @ 17:56:30
Missouri will likely be called for McCain after provisional ballots are processed. Usually, only about half are counted, and there are only 7,000 some of them. http://www.timesonline.co.uk/tol/news/world/us_and_americas/us_elections/article5108320.ece
So Missouri looses its bellweather status. Ohio is the most accurate predictor: Since 1896:
Only in 1944 and 1960 has Ohio gone for the losing candidate.

Missouri went for William Jennings Bryan in 1896 and 1900, for Adlai Stevenson in 1956, and now it seems for John McCain in 2008.
prediction Map

 By: whoblitzell (I-JPN) 2008-11-07 @ 20:58:18
Missouri has always struck me as a deeply pragmatic state. They might have been more impervious to Obama's idealism than the rest of the country.prediction Map

 By: FiveSenses99 (--MO) 2008-11-07 @ 22:35:39
As a native of MO, I know the only reason Obama lost this state was the color of his skin.

Trust me.
prediction Map

 By: bonncaruso (D-DEU) 2008-11-08 @ 10:22:54
There must be a reason for why MO is not yet called. I would not be so sure for one candidate or the other yet.

Wait and see.

For those who know me, this has been my motto all along.

:) :)
prediction Map

 By: FiveSenses99 (--MO) 2008-11-08 @ 12:05:19
MO was called (for McCain), at least according to some sources. prediction Map

 By: wingindy (I-IN) 2008-11-08 @ 12:47:18
My understanding is that there are 10-15,000 provisional vote to be processed in Missouri next week. Typically, only about half of provisionals end up counting, and it is doubtful that Obama would win an overwhelming majority of those that do. Stll, it ain't over until the fat lady sings.prediction Map

 By: wingindy (I-IN) 2008-11-08 @ 14:02:40
SO it appears that we have a new bellwether state, Ohio, voting for the loosing candidate only twice since 1896, and with the winning candidate in every year since 1964.

What of bellwether counties? Liep identifies eight counties as having voted for the winning candidate in every year between 1960 and 1996. Two of these, in Deleware and New Mexico, went for Gore in 2000 and Kerry in 2004.

Of the remaining six, the two in Arkansas, Van Buren & Logan counties, went for McCain by 31 and 40%, respectively, shooting their bellweather status all to hell. Eddy County, New Mexico and Lincoln County, Missouri supported McCain by 23% and 12.5%, respectively, ending their runs. Ferry County, Washington supported McCain by 13%. Its done.

There is one and only ONE COUNTY in the entire United States of America to choose the winning presidential candidate in every election from 1960 though 2008. VIGO COUNTY, INDIANA, which supported Obama by nearly 16% IS the nation's bellwether County!!

Last Edit: 2008-11-08 @ 14:03:51
prediction Map

 By: bonncaruso (D-DEU) 2008-11-09 @ 08:24:35
Unbelievable!!!

And I thought the Hoosiers only made great basketball players, great musical instruments and huge music conservatories....

WOW.

Tonight after my concert, I will toast Vigo county.
prediction Map

 By: bonncaruso (D-DEU) 2008-11-09 @ 08:25:43
And I notice that still, the major outlets have not yet called MO.

Wait and see.

After waiting 21 months, I can wait a couple of more days.
prediction Map

 By: wingindy (I-IN) 2008-11-09 @ 12:53:35
More on Vigo County: In fact, the county has only not picked the national choice in two elections since 1892 -- 1908 and 1952.

Vigo County is twice the size of Both Eddy County, NM & Ferry County, WA, and the others are even smaller and more rural.
prediction Map

 By: tmthforu94 (D-MO) 2008-11-11 @ 12:44:16
Vigo County is interesting. I'm there a lot, and know a lot of people there. They like to see the candidate. Obama was in Vigo County 3 time. McCain never appeared. Because of that, Vigo county voted +10% for Obama. If McCain would have made a stop or two there though, I bet McCain would have won it, and Vigo also would have lost its Bellweather status.prediction Map

 By: wingindy (I-IN) 2008-11-11 @ 13:55:35
Vigo went +16% for Obama, 57-41. McCain's last minute stop at the Indianapolis airport was a little too little, a little too late.
I think he only visited the entire state 6 times all year, most of those small fundraising gatherings.
prediction Map

 By: hotpprs (R-NY) 2008-11-11 @ 14:21:04
Wingindy.
Yes, Ohio is the champ of bellwethers now, but don't forget about Nevada, as I think they are now 2nd. And Delaware can be considered tops also, as they did vote for the popular vote winner in 2000, Al Gore.
I just posted my analysis of the election based on the exit poll results.

http://www.cnn.com/ELECTION/2008/results/polls/#USP00p1

I now realize, McCain and Palin really couldn't have won this. Forget about blaming Palin, or McCain's bad week during the bank crashes, they could not have received the electoral votes they needed on the ticket they presented.
It looks like the only way the GOP had a chance, was to nominate someone more popular with hispanics on the top of the ticket, or as the VP choice.
The next few years should prove interesting to see if the GOP gets the message.
prediction Map

 By: wingindy (I-IN) 2008-11-11 @ 15:33:45
I go along with you on NV. Its voted for the winner every year since 1980, and 1976 is the only year it went with the looser since 1908.

DE is a stretch. Even if you make an exception for '00, it supported Kerry in '04, Dewey in '48, and Hoover in '32!!

McCain was in a trickbox. Without clearly repudiating the GOP on anti-immigration stances, he was destined to loose latinos by a bunch. If he had done so, however, he would have lost large segments of his base. How about Mel Martinez in 2012?
prediction Map

 By: hotpprs (R-NY) 2008-11-11 @ 19:02:49
I really don't know much about Mel Martinez. But he's in the right state at the right time. But from what I read on the internet, he is not wildly popular. I think the GOP needs Bill Richardson to switch parties. Ha ha.
If the Dems were smart, they would drop Biden in 2012, and pick Richardson as the VP to set him up for 2016. (sounds too far away, right?). I don't think he was picked this year because it would have been just too big of a chance to have 2 minorities on the same ticket for the 1st time. But if Obama does a good job as President, I don't think that would be an issue in 2012.
Poor Hillary.
prediction Map

 By: whoblitzell (I-JPN) 2008-11-12 @ 08:26:22
The Republican party needs to change its image from being the party of old, rich white guys.prediction Map

 By: bonncaruso (D-DEU) 2008-11-12 @ 11:21:36
hotpopprs has made interesting points. But McCain did run a badly organized campaign that looked like it was flailing wildly about, especially in the last 3 weeks of the campaign.

And I stand 110% by my many, many, many arguments that the pick of Palin was a fatal flaw on McCain's part.

And Palin herself delivered the evidence for every single one of my arguments. And apparently, the center saw it as I did and voted for Obama.
prediction Map

 By: bonncaruso (D-DEU) 2008-11-12 @ 14:57:59

THE NATIONAL POPULAR VOTE (continuing update):


The final national polls on 11/03-11/04 had an average of +7.54, and I made the following prediction:


Obama: 52.77%

McCain:45.23%

Other: 2%


As of 11/12, 14:30 EDT, the PV and percentages:


Candidate

Pop. Vote

%

Pop. Margin

% Margin

Obama (D)

66,354,771

52.66%

+8,336,450

+6.61%

McCain (R)

58,018,321

46.05%

Nader (I)

691,277

0.55%

Barr (L)

507,495

0.40%

Baldwin (C)

180,864

0.14%

McKinney (G)

150,427

0.12%

Other

97,430

0.08%

Total

126,000,585

100.00%


Comparison: my projection to current results:


Candidate

Current %

Bonncaruso's prediction:

Difference:

Obama (D)

52.66%

52.77%

-0.11%

McCain (R)

46.05%

45.23%

+0.82

All others

1.29%

2.00%

-0.71%


Comparison to 2004:


Year

Democratic:

Republican:

All Others:

Total:

2008

66,354,771

58,018,321

1,627,493

126,000,585

2004

59,028,439

62,040,610

1,224,499

122,293,548

Difference:

+7,326,332

-4,022,289

+402,994

+3,707,037


Tendency: rising for Obama.


I missed McCain's percentage. But am only 0.11% away from Obama's percentage. And these numbers will change again a number of times. The statistical probability is extremely high that Obama comes up to at least 52.70%.

prediction Map

 By: wingindy (I-IN) 2008-11-13 @ 15:22:30
The Indianapolis Star has done an anaylsis of presidential election precinct voting in the metropolitan area.

Included is some evidence favcoring the view that a decent chunk of Republicans voting in the democratic primary were motivated by 'operation chaos':

"The primary revisited
Remember all the fuss over Republicans voting in droves in the Democratic primary? Well, the analysis might shed some light on why.

Could it be that those voters switched party allegiance and became part of a new Democratic coalition? It doesn't appear so.

Thirty-six percent of the metro-area precincts where most people voted for Democrats in the May primary chose McCain last week.

In Boone County, 44 of 45 precincts that voted mostly Democratic in May voted for McCain in the general election.

So, it appears what most inspired that large GOP crossover in the primary was either a desire to be part of the action -- any action -- since McCain already had locked up the nomination, or an attempt by Republican voters to try to influence the outcome between Obama and Sen. Hillary Rodham Clinton."

My precinct voted 63.8% for Obama, 35.2% McCain, and 0.75% for Barr, nearly identical to the County wide result. One Eastside precinct was nearly unanimous for Obama - 333 to 1 write-in (wonder who?).
prediction Map

 By: tmthforu94 (D-MO) 2008-11-14 @ 12:48:38
Interesting comment on Indiana voting in the primary.
Many Republicans, including my family, has very negative views on Obama. Personally, though I am Republican, I really like Hillary. So during the primaries we, as well as many people in OUR area, voted for Hilary to 1)Cause more chaos in the Democrat primary 2) Help Hillary
My county, Clay, voted overwhelmingly more Democrat in primaries, but voted comfortably McCain in the primaries.
prediction Map

 By: wingindy (I-IN) 2008-11-14 @ 13:42:15
I don't doubt that there were Hillary voters who voted McCain in the general. The more interesting question is, how many of those folks would have voted for McCain EVEN IF Hillary were the Dem. nominee.

Still, the margin was 26 points closer than 4 years ago, a change similar to that seen accross the state. An estimated 150,000 voters who chose Bush in '04 did not vote for McCain.
prediction Map

 By: wingindy (I-IN) 2008-11-18 @ 14:56:59
Here's another idea on bellwether counties: based on how they matched the nationwide swing for or against the winning party. There are a number of Indiana counties on there, but most of them swung too hard to Obama to remain on the list. I find that very funny. http://massinc.typepad.com/beyondredandblue/2008/08/top-50-bellweth.htmlprediction Map

 By: bonncaruso (D-DEU) 2008-11-20 @ 18:06:42
If the current percentages hold, then with the Obama win in IN, there has been a margin shift of R + 20.68 in 2004 to D +1.04 in 2008, which makes a partisan shift of D +21.72, which, behind the partisan shift of +36.53 in HI will be the second largest shift of the evening and the largest cross-party shift (meaning, in a state that switched from one party to another) of the GE in 2008. I will be researching this, but this may also be the largest cross party shift in any state since 1964, perhaps since 1936.

Indeed, the shifts are amazing.

Here the 9 "red" states that Obama picked up. Listed is only the partisan shift (that would be Obama's current margin minus the Bush margin from 2004. The Bush margin, from the liberal perspective, would be a negative value, so a minus of a minus = a +. For instance: IN D +1.04 - (R -20.68) = D +21.72). Note: these values may change some again, when the official results are cast in stone.

IN: D +21.72
NM: D +15.90
NV: D +15.09
VA: D +14.49
CO: D +13.32
NC: D +12.44
IA: D +9.94
FL: D +7.82
OH: D +5.82

Note that six (well, actually, seven) of these nine values are in double digits, indicating a landslide SHIFT, not necessarily a landslide win. There is a difference, to be sure.

This will all be in my final report when the time is ripe.

Last Edit: 2008-11-20 @ 18:11:31
prediction Map

 By: wingindy (I-IN) 2008-11-20 @ 22:13:34
Very nice. :) In Indiana, this shift was double digits nearly statewide.prediction Map

 By: bonncaruso (D-DEU) 2008-11-22 @ 07:37:16
I have posted a 3rd preliminary report from the GE 11/04 on my blog.

There are just tons of factoids in this report that will fascinate. I encourage all to read the whole report.

There are some other factiods that I am first pre-releasing only on this website.

Go to my blog and notice on the large table that:

-the percentages and margins for WA an ME, the two most far-flung continental states, extreme NW and extreme NE, are almost identical to each other.

-Obama beat McCain WEST of the Mississippi river: 97 EV to 85 EV. This is the first time since 1992 that a DEMOCRAT won west of the Mississippi. Not only that, he one every single state west of the Mississippi with a landslide (yes, including CO).

-Obama won all of the NORTHEAST (Aceola) and all of the rust-belt/mid-west states (depending on how you categorize the Dakotas, there is not concensus on this point). By winning IN, this is the first time since 1964 that a DEMOCRAT has won such a long stretch of contiguous states. Not even FDR won this configuration of states, either in 1932, 1936, 1940 or 1944. FDR won more states, but not this configuration.

In the post above this one here on my map, I wrote:

"The national popular vote will most likely go over 128 million and Obama will probably hit 67.6 or 67.7 million. I bet his percentage will come closer to the 52.77% that I predicted on Nov. 3rd for Nov. 4th. Wait and see."


Well, take a look:

Current PV total: 128,110,073
Obama current: 67,562,020 (52.74%)
McCain current: 58,759,016 (45.87%)
Margin: +8,803,004 (+6.87%)

Obama is currently at 52.74%. I predicted 52.77%, so we only have 0.03% more to go before it's a lock!!!

Obama is close to breaking Bush's PV record by 6,000,000 votes. He may also surpass a 9 million vote plurality over McCain.

Last Edit: 2008-11-23 @ 01:46:12
prediction Map

 By: bonncaruso (D-DEU) 2008-11-23 @ 02:21:40

So, I have already finished crunching all the numbers for all states, as of midnight between Nov. 22 and Nov. 23, EDT.


Here they are. The font is very small to accomodate a large table. If you are using Firefox, „Ctrl +“ will enlarge the whole thing for you. If you are using IE 8, there is a magnifying symbol at the bottom right hand corner of your browser, similar story for Opera 9.


The table is, I believe, unique in the internet as it gives a direct comparison to 2004, both in raw numbers and in percentages and also in partisan shift.


The blue numbers are democratic, the red numbers are republican, and the bold numbers are those of the winner.


The columns to the left that are shaded in grey indicate a final tally, no more updates are expected from these states.


Here is an example from the table:


St.

Obama

%

McCain

%

Other

%

TOTAL

Mar.

Mar %

USA

67,969,029

52.76

59,075,413

45.86

1,784,531

1.38

128,828,973

8,893,616

6.90

2004

59,028,439

48.27

62,040,610

50.73

1,224,499

1.00

122,293,548

3,012,171

2.46

Diff:

+8,940,590

+4.49

-2,965,197

-4.87

+560,032

+0.38

+6,535,425

+11,905,787

+9.36

AR

414,826

38.81

628,710

58.82

25,424

2.37

1,068,960

213,884

20.01

2004:

469,953

44.55

572,878

54.31

12,094

1.15

1,054,945

102,945

9.76

Diff:

-55,127

-5.74

+55,832

+4.51

13,330

+1.22

+14,015

+110,939

+10.25

CA

7,819,181

61.18

4,721,634

36.94

239,522

1.88

12,780,337

3,097,547

24.24

2004:

6,745,485

54.31

5,509,826

44.36

164,546

1.32

12,419,857

1,235,659

9.95

Diff:

+1,073,696

+6.87

-788,192

-7.42

+74,976

+0.56

+360,480

+1,861,888

+14.21


Nationally, if my projection of 52.76% for Obama holds (this is only 0.01% away from my prediction, btw), then this means that the DEMS gained 4.49% in the national popular vote over 2004, the GOP lost 4.87% over 2004 and the IND (other) vote gained 0.38% over 2004. The margin difference means that the DEMS came from 3 million behind in 2004 to almost 9 million ahead in 2008, an almost 12,000,000 vote shift. Translated into %, that would be the so-called partisan shift. If Obama holds at 52.76%, then the partisan shift in the nation would be +9.36.


On to Arkansas. Since there are so very few states where Obama got less votes than Kerry did in 2004, I have underlined those examples (AR, LA, OK, WV).


Look at CA. Currently, only 360,480 more votes than in 2004. I suspect that yet more votes are to come in from California. Obama's percentage in CA is the second highest for any DEM in history (after 1936) and the fifth highest for any candidate of any party. His margin is the third highest in the history of the state (after 1936, 1928).


I believe that seeing the difference this way in hard cold numbers is very illustrating.


Comparison - my projection to current results that I have found:


Candidate

Current %

Bonncaruso's prediction:

Difference:

Obama (D)

52.76%

52.77%

-0.01%

McCain (R)

45.86%

45.23%

+0.63

All others

1.38%

2.00%

-0.62%


This puts my projection from Nov 4th (before the polls closed) just 0.01% off from reality. I still missed McCain's margin by more than ½ point (which is more than just statistical noise), but my topline for Obama was right on the money.


Last Edit: 2008-11-23 @ 02:28:28
prediction Map

 By: bonncaruso (D-DEU) 2008-11-23 @ 02:36:02
Here the same table, smaller font.prediction Map

 By: bonncaruso (D-DEU) 2008-11-24 @ 16:41:02
According to BALLOT ACCESS NEWS, the official canvas from the state of California will not come out until December 13th, which is a Saturday.

There is disagreement as to why this is so. The American Independent Party of CA is claiming that one democratic elector who had been submitted to be on the slate of electors was not correctly registered in Los Angeles County.

Others argue that the deluge of absentee ballots is taking time to sort out.

I think that both arguments have enough holes in them to pass for swiss cheese.

Anyhow, no official report from me until after December 13th, apparently, since the report can't be made until all data is cast in stone. Hmmmm.....
prediction Map

 By: bonncaruso (D-DEU) 2008-11-25 @ 17:49:34

52.77!!!!!!!


Currently, Obama's national average, which last week was at +6.72, has moved up to at least +6.92, a margin jump of +0.20 in 9 days. Interestingly enough, the state in the Union that comes the closest to mirroring the national average is: VA.


If Obama holds at +6.92, then the national partisan shift from 2004 to 2008 would be: +9.38


The final national polls on 11/03-11/04 had an average of +7.54, and I made the following prediction:


Obama: 52.77%

McCain:45.23%

Other: 2%


As of 11/25, 17:00 EDT, here are the numbers I have:


Candidate

Pop. Vote

%

Pop. Margin

% Margin

Total

129,147,277

100.00%

--

--

Obama (D)

68,141,444

52.77%

+8,937,640

+6.92%

McCain (R)

59,223,804

45.85%

Other:

1,789,029

1.38%


Comparison - my projection to current results:


Candidate

Current %

Bonncaruso's prediction:

Difference:

Obama (D)

52.77%

52.77%

+/- 0.00%

McCain (R)

45.85%

45.23%

+0.62

All others

1.38%

2.00%

-0.62%


Comparison to 2004:


Year

Democratic:

Republican:

All Others:

Total:

2008

68,141,444

59,223,804

1,789,029

129,147,277

2004

59,028,439

62,040,610

1,224,499

122,293,548

Difference:

+9,113,405

-2,816,806

+564,530

+6,853,729


If the tend continues, then Obama may somewhat overshoot 52.77, but for now, my prediction is EXACTLY on the money.

prediction Map

 By: bonncaruso (D-DEU) 2008-12-02 @ 14:11:08
Here is preliminary report no. 4, the last report before the final report.

Here is part of the report:

As of 12/02, 06:00 EDT, the PV and percentages:


Candidate

Pop. Vote

%

Pop. Margin

% Margin

Total

129,805,369

100.00%

--

--

Obama (D)

68,496,622

52.77%

+9,061,299

+6.98%

McCain (R)

59,435,023

45.79%

Other:

1,824,704

1.44%


Comparison - my projection to current results:


Candidate

Current %

Bonncaruso's prediction:

Difference:

Obama (D)

52.77%

52.77%

+/-0.00%

McCain (R)

45.79%

45.23%

+0.56

All others

1.44%

2.00%

-0.56%


Comparison to 2004:


Year

Democratic:

Republican:

All Others:

Total:

2008

68,496,622

59,435,023

1,824,704

129,805,369

2004

59,028,439

62,040,610

1,224,499

122,293,548

Difference:

+9,467,883

-2,605,587

+649,525

+7,511,821


Tendency: Obama stabilizing at 52.77%. As far as I can see, I am the only blogger in the entire net who predicted this percentage, and currently, it is right on the money.

prediction Map

 By: bonncaruso (D-DEU) 2008-12-06 @ 08:53:38

THE NATIONAL POPULAR VOTE UPDATE:


Currently, Obama's national average, which was at +6.98 on 12/02, has moved to +7.16, a margin jump of +0.18 in four days: The current national percentages and margin are pretty much in the middle between Obama's win in VA (+6.30) and CO (+8.95) and is now coming closer and closer to the national poll averages from 11/03.


If Obama holds at +7.16, then the national partisan shift from 2004 to 2008 would be: +9.62 (+7.16 - (-2.46) = +9.62)


The final national polls on 11/03-11/04 had an average of +7.54, and I made the following prediction:


Obama: 52.77%

McCain:45.23%

Other: 2%


As of 12/06, 08:00 EDT, the PV and percentages:


Candidate

Pop. Vote

%

Pop. Margin

% Margin

Total

130,700,139

100.00%

--

--

Obama (D)

69,077,276

52.85%

+9,361,935

+7.16%

McCain (R)

59,715,341

45.69%

Other:

1,907,522

1.46%


Comparison - my projection to current results:


Candidate

Current %

Bonncaruso's prediction:

Difference:

Obama (D)

52.85%

52.77%

+0.08%

McCain (R)

45.69%

45.23%

+0.46%

All others

1.46%

2.00%

-0.54%


Comparison to 2004:


Year

Democratic:

Republican:

All Others:

Total:

2008

69,077,276

59,715,341

1,907,522

130,700,139

2004

59,028,439

62,040,610

1,224,499

122,293,548

Difference:

+10,048,837

-2,325,269

+683,023

+8,406,591


Tendency: Obama has moved above the 52.77% I predicted. Good for him, bad for me :) :) So, I have currently missed his winning percentage by 0.08%, but am now less than one half point away from McCain's percentage. If this trend continues for the remaining official results/canvasses, then Obama could rise to 52.87%-52.88% and McCain may sink to 45.67%-45.68%, so the margin may hit an even +7.20 for Obama.


Other than CA and TX, most of the big states have either final results or official canvasses. I suspect that there are less than 500,000 votes remaining outstanding, but we will probably go over 131 million votes in 2008. CA will put out it's official canvass on 12/13.

prediction Map

 By: bonncaruso (D-DEU) 2008-12-10 @ 16:33:23

Currently, Obama's national average, which was at +7.16 on 12/06, has moved to +7.25, a margin jump of +0.09 in four days: The current national percentages and margin are pretty much in the middle between Obama's win in VA (+6.30) and CO (+8.95) and is now coming closer and closer to the national poll averages from 11/03. His current percentage, historically ranked, comes closest to Ulysses B. Grant from 1868 (52.66%) and his percentages comes closes to FDR from 1944 (+7.49). I will be doing a large rankings work up, it will be posted as soon as the FINAL CANVASS is done.


We have now crossed over the 131 million vote mark. And more than 9,000,000 more voters went to the polls in 2008 than in 2004.


With only 5 states still posting unofficial numbers and a sixth state (MA) still pending for some mysterious reason, and with 29 states having posted FINAL numbers but no official canvass (yet), I suspect that there are at the most no more than 100,000, maybe 150,000 votes left to tally. California will put out it's official CANVASS on 12/13 and if there are any major shifts in numbers, they will probably be the most noticable here. Dr. Michael McDonald from George Mason University has an EXCELLENT website about this and his tracking of the numbers is excellent.


If Obama holds at +7.25, then the national partisan shift from 2004 to 2008 would be: +9.71 (+7.25 - (-2.46) = +9.71)


The final national polls on 11/03-11/04 had an average of +7.54, and I made the following prediction:


Obama: 52.77%

McCain:45.23%

Other: 2%


As of 12/10, 16:00 EDT, the PV and percentages:


Candidate

Pop. Vote

%

Pop. Margin

% Margin

Total

131,309,422

100.00%

--

--

Obama (D)

69,445,987

52.89%

+9,522,569

+7.25%

McCain (R)

59,923,418

45.64%

--

--

Other:

1,940,017

1.44%

--

--


Comparison - my projection to current results:


Candidate

Current %

Bonncaruso's prediction:

Difference:

Obama (D)

52.89%

52.77%

-0.12%

McCain (R)

45.64%

45.23%

+0.41

All others

1.48%

2.00%

+0.52%

Margin

+7.25

+7.54

+0.29


Comparison to 2004:


Year

Democratic:

Republican:

All Others:

Total:

2008

69,445,987

59,923,418

1,940,017

131,309,422

2004

59,028,439

62,040,610

1,224,499

122,293,548

Difference:

+10,417,548

-2,117,192

+715,518

+9,015,874


Tendency: Obama shot past my predicted 52.77% (ah, the joy was but short lived), but overall, my prediction is about as close to the bullseye as you can get: I am currently off by 0.12 on Obama's %, 0.29 on the margin and 0.41 on McCain's percentage – all under one half of a point.

prediction Map

 By: bonncaruso (D-DEU) 2008-12-17 @ 03:57:02
It looks like, when all is said and done and the very last straggler write-in votes will be made official in the next 30-60 days, that Obama's national winning margin will be +7.24.

Of this, I am 99.999% sure, but not 100%. But it looks like it.

With that in mind, that makes the national swing from 2004 to 2008: +9.70.

With these numbers now set in stone, I am just about to produce the end-statistics in a massive way. Stay tuned.
prediction Map

 By: wingindy (I-IN) 2008-12-17 @ 23:01:36
Staying tuned.

Intersting developments in the Senate with open seats to be filled in IL, NY & CO. It doesn't do much for map makers, though.

The cabinet is shaping up nicely. Also, looks like no "unfaithful electors" this year.

You can all go back to bed now.
prediction Map

 By: dnul222 (D-MN) 2008-12-18 @ 19:30:18
MN shifting to Franken in the count on Friday!

Ho Ho Ho

And this from a canvassing board of Republican judges!
prediction Map


User's Predictions

Prediction Score States Percent Total Accuracy Ver #D Rank#Pred
P 2020 President 53/56 36/56 89/112 79.5% pie 7 6 434T684
P 2020 Senate 33/35 21/35 54/70 77.1% pie 4 4 101T423
P 2018 Senate 32/35 21/35 53/70 75.7% pie 3 27 132T483
P 2018 Governor 33/36 23/36 56/72 77.8% pie 3 21 94T372
P 2016 President 53/56 22/56 75/112 67.0% pie 21 1 440T678
P 2016 Senate 28/34 17/34 45/68 66.2% pie 5 5 277T362
P 2016 Governor 7/12 2/12 9/24 37.5% pie 1 94 269T279
P 2014 Senate 34/36 21/36 55/72 76.4% pie 4 0 122T382
P 2014 Governor 27/36 17/36 44/72 61.1% pie 2 16 171T300
P 2012 President 54/56 41/56 95/112 84.8% pie 9 0 314T760
P 2012 Senate 32/33 14/33 46/66 69.7% pie 1 191 189T343
P 2012 Rep Primary 35/52 12/52 47/104 45.2% pie 10 - 83T231
P 2010 Senate 35/37 21/37 56/74 75.7% pie 9 15 116T456
P 2010 Governor 30/37 15/37 45/74 60.8% pie 1 299 214T312
P 2008 President 54/56 44/56 98/112 87.5% pie 22 1 41T1,505
P 2008 Senate 32/33 24/33 56/66 84.8% pie 5 1 14T407
P 2008 Governor 11/11 6/11 17/22 77.3% pie 1 4 86T264
P 2008 Dem Primary 45/52 21/52 66/104 63.5% pie 8 - 26T271
P 2008 Rep Primary 43/49 11/49 54/98 55.1% pie 11 - 31T235
Aggregate Predictions 671/752 389/752 1060/1504 70.5% pie


Back to 2008 Presidential Prediction Home - Predictions Home


Terms of Use - DCMA Policy - Privacy Policy and Cookies

© Dave Leip's Atlas of U.S. Elections, LLC 2019 All Rights Reserved