


|
Date of Prediction: 2008-10-30 Version:8
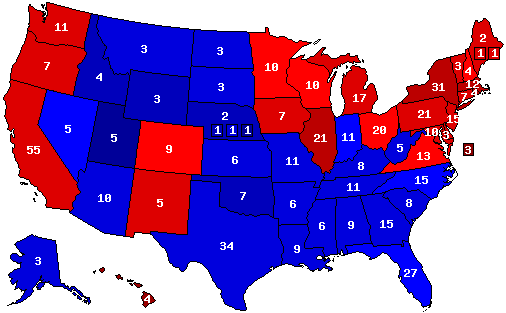
Prediction Map
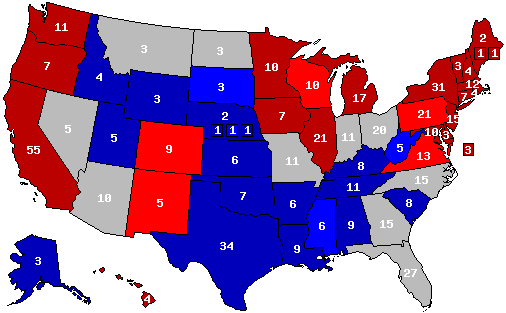
Confidence Map
Prediction States Won
Confidence States Won
State Pick-ups
Prediction Score (max Score = 112)
Analysis
Last update, 5 days before election, takes Nevada into the Republican column (relatively low early voting numbers, esp. among youth & minorities, bodes well for McCain), but the preponderance of polls led me to move Ohio into the Obama camp.
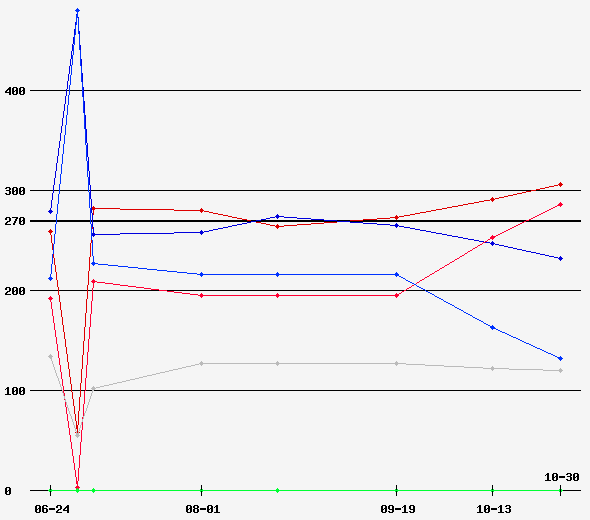
Prediction History
Comments History
- show
Version History Member Comments User's Predictions
Links
|
||||||||||||||||||||||||||||||||||||||||||||||||||||||||||||||||||||||||||||||||||||||||||||||||||||||||||||||||||||||||||||||||||||||||||||||||||||||||||||||||||||||||||||||||||||||||||||||||||||
 2020 President
 2016 President
 2008 President
 2006 U.S. Senate
 2006 Governor
 2004 President
Back to 2008 Presidential Prediction Home - Predictions Home