


|
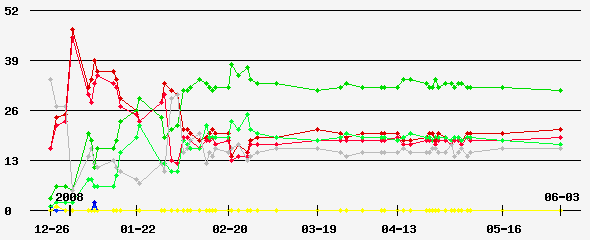
Date of Prediction: 2008-06-03 Version:55
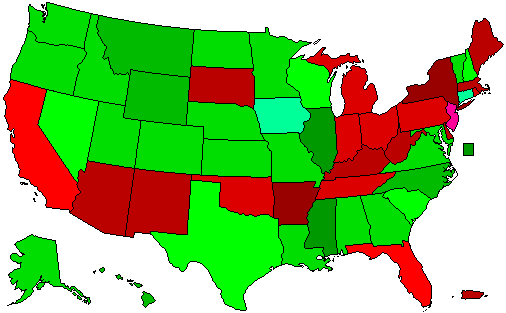
Prediction Map
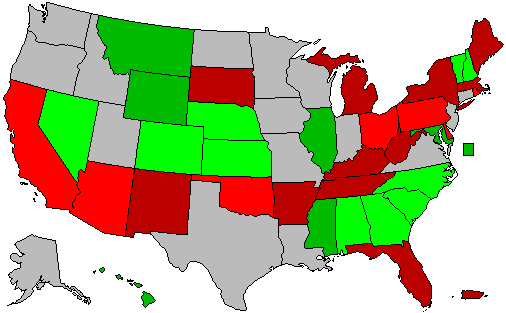
Confidence Map
Prediction States Won
Confidence States Won
Prediction Score (max Score = 104)
Analysis
No Analysis Entered
Prediction History
Comments History
- hide
Version: 46 final prediction: Dems split the remaining contests: Version: 45 Final prediction, Clinton loses in all categories and Obama wins primary. Version: 33 Clinton makes a comeback and win IN, NC and PA while FL and MI appeals to the state Democratic party. Version: 14 Post Edwards dropping out helps Obama in the southern primaries. Version: 8 Hillary is the safer bet than Giuliani is to win the nomination, but what type of bounce will SC have on the race. Feb 5th will decide the nomination. Version: 4 Final predictions before the voting begins.
Version History Member Comments User's Predictions
Links
|
|||||||||||||||||||||||||||||||||||||||||||||||||||||||||||||||||||||||||||||||||||||||||||||||||||||||||||||||||||||||||||||||||||||||||||||||||||||||||||||||||||||||||||||||||||||||||||||||||||||||||||||||||||||||||||||||||||||||||||||||||||||||||||||||||||||||||||||||||||||||||||||||||||||||||||||||||||||||||||||||||||||||||||||||||||||||||||||||||||||||||||||||||||||||||||||||||||||||||||||||||||||||||||||||||||||||||||||||||||||||||||||||||||||||||||||||||||||||||||||||||
 2024 President
 2023 Governor
 2022 Senate
 2022 Governor
 2021 Governor
 2020 President
 2020 Senate
 2020 Governor
 2019 Governor
 2018 Senate
 2018 Governor
 2017 Governor
 2016 President
 2016 Senate
 2016 Governor
 2015 Governor
 2014 Senate
 2014 Governor
 2013 Governor
 2012 President
 2012 Senate
 2012 Governor
 2012 Rep Primary
 2011 Governor
 2010 Senate
 2010 Governor
 2009 Governor
 2008 President
 2008 Senate
 2008 Governor
 2008 Dem Primary
 2008 Rep Primary
 2007 Governor
 2006 U.S. Senate
 2006 Governor
 2004 President
Back to 2008 Dem Presidential Primary Prediction Home - Predictions Home