


|
Date of Prediction: 2008-04-21 Version:15
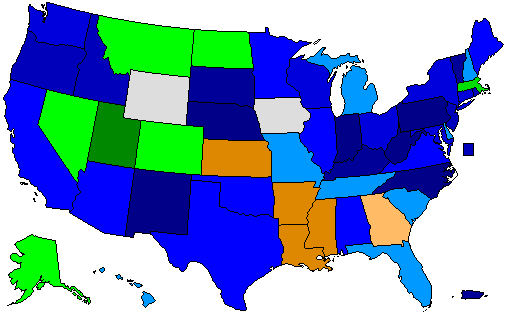
Prediction Map
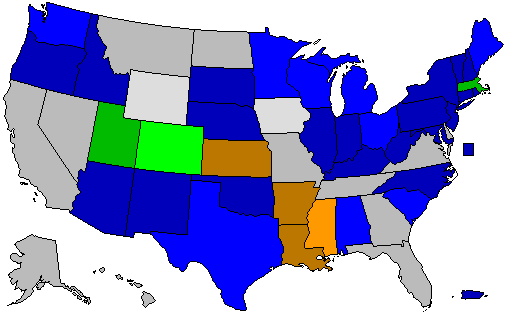
Confidence Map
Prediction States Won
Confidence States Won
Prediction Score (max Score = 104)
Analysis
No Analysis Entered
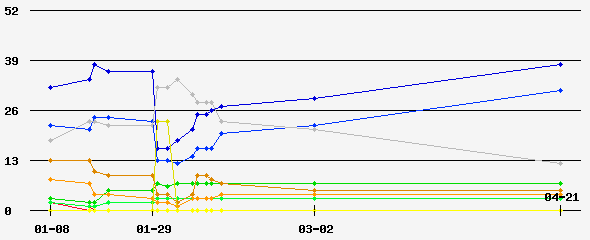
Prediction History
Comments History
- hide
Version: 2 By the end of February, Giuliani and Thompson drop out, endorsing McCain, and Romney drops out as well. Huckabee and McCain compete in the remaining states. Version: 1 McCain wins New Hampshire and then Michigan. Is competitive in SC but loses to Huckabee. Fred Thompson fails to gain momentum and drops out, endorsing McCain. Giuliani wins his home turf of New York and New Jersey, but loses other centrist and left-leaning states to the campaign momentum and environmental advocacy of McCain, whom Rudy afterwards endorses. Romney wins only a few states before dropping out late in February, leaving McCain and Huckabee to battle it out - McCain winning in the North and West, and Huckabee in the South. Ron Paul continues his campaign long enough to leave Huckabee a non-majority win in Texas.
Version History Member Comments User's Predictions
Links
|
||||||||||||||||||||||||||||||||||||||||||||||||||||||||||||||||||||||||||||||||||||||||||||||||||||||||||||||||||||||||||||||||||||||||||||||||||||||||||||||||||||||||||||||||||||||||||||||||||||||||||||||||||||||||||||||||||||||||||||||||||||||||||||||||||||||||||||||||||||||||||||||||||||||||||||||||||||||||||||||||||||||||||||||||||||||||||
 2022 Senate
 2022 Governor
 2020 President
 2020 Senate
 2020 Governor
 2019 Governor
 2018 Senate
 2018 Governor
 2016 President
 2016 Senate
 2016 Governor
 2014 Senate
 2014 Governor
 2012 President
 2012 Senate
 2012 Governor
 2012 Rep Primary
 2010 Senate
 2010 Governor
 2008 President
 2008 Senate
 2008 Dem Primary
 2008 Rep Primary
Back to 2008 Rep Presidential Primary Prediction Home - Predictions Home