


Note: The Google advertisement links below may advocate political positions that this site does not endorse.
|
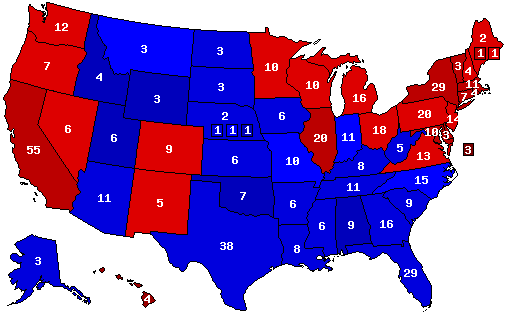
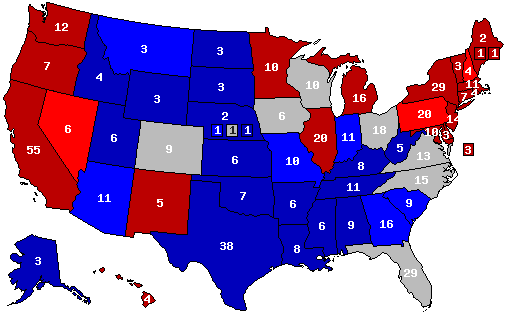
Date of Prediction: 2012-08-17 Version:2
Prediction Map
Confidence Map
Prediction States Won
Confidence States Won
State Pick-ups
Prediction Score (max Score = 112)
Analysis
No Analysis Entered
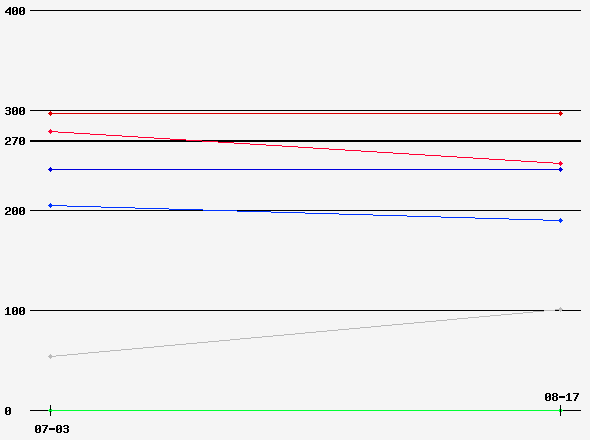
Prediction History
Comments History
- hide
Version: 1 Ohio, Florida and Iowa are pure toss ups but Ohio could tilt Obama because of the auto-bailout being popular there and the good economy there and in Iowa. The housing market and Cuban Americans could tilt Florida in Romney's favor but it's still razor close.
Version History Member Comments User's Predictions
User Info
Links
|
||||||||||||||||||||||||||||||||||||||||||||||||||||||||||||||||||||||||||||||||||||||||||||||||||||||||||||||||||||||||||||||||||||||||||||||||||||||||||||||||||||||||||||||||||||||||||||||||||||||||||||||||||||||||||||||||||||||||||||||||||||||||||||||||||||||||||||||||||||||||||||||||||||
 2020 President
 2020 Senate
 2020 Governor
 2018 Senate
 2016 President
 2016 Senate
 2016 Governor
 2015 Governor
 2014 Senate
 2014 Governor
 2013 Governor
 2012 President
 2012 Senate
 2012 Governor


Back to 2012 Presidential Prediction Home - Predictions Home
© Dave Leip's Atlas of U.S. Elections, LLC 2019 All Rights Reserved