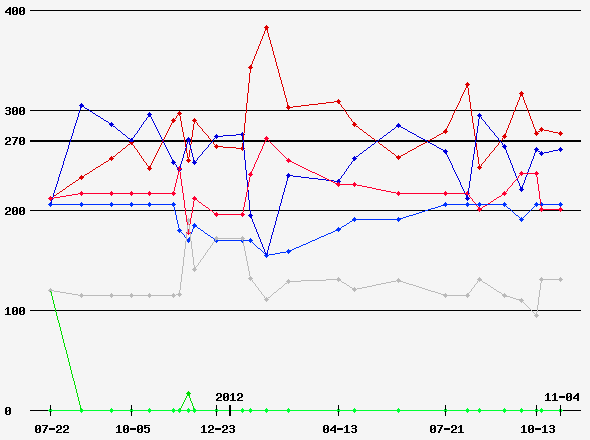
Comments History
-
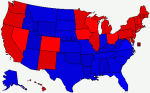
hideVersion: 24
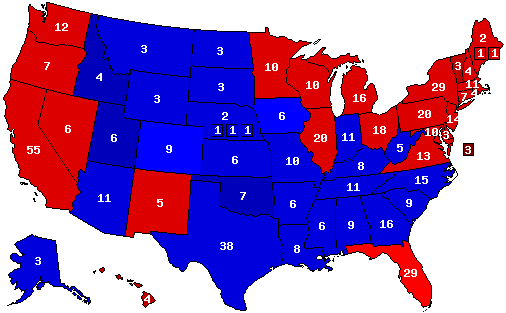
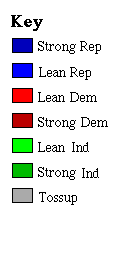
Mitt Romney (R-MA)/Paul Ryan (R-WI): 49%
Barack Obama (D-IL)/Joe Biden (D-DE): 48%
Other: 3%
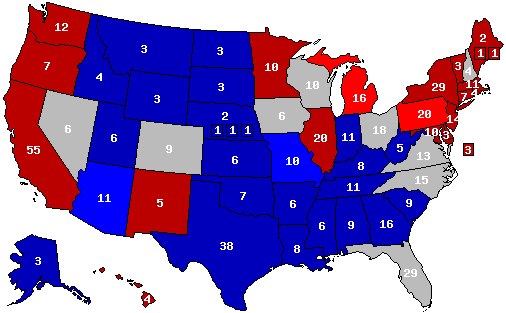
Version: 23
Barack Obama (D-IL)/Joe Biden (D-DE): 49%
Mitt Romney (R-MA)/Paul Ryan (R-WI): 48%
Other: 3%
Version: 22
Barack Obama (D-IL)/Joe Biden (D-DE): 50%
Mitt Romney (R-MA)/Paul Ryan (R-WI): 47%
Other: 3%
There are two ways this election could play out at this point depending on how the American people decide to make their choice.
1. The electorate will judge the race on our anemic economy and thus have a referendum on Obama's policies and presidency. Here Mitt Romney wins on a protest vote much as what happened in 2010.
2. The electorate will judge the race on incumbency and thus whether not Mitt Romney is a preferred alternative to the current administration. In this case Obama is reelected as people won't see much value in changing.
At the moment the second outcome is the most likely.
Version: 21
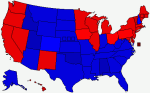
Barack Obama(D-IL)/Joe Biden(D-DE): 49%
Mitt Romney (R-MA)/Paul Ryan (R-WI): 48%
Other: 3%
A very close race coming down to a hand full of swing states scattered about the country.
Version: 20
Best Case Scenario for the Republicans
Romney(MA)/Ryan(WI) 51%
Obama(IL)/Biden(DE) 48%
Other 1%
Swing states break more or less for Romney while the economy remains stagnate.
Version: 19
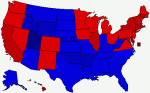
President Obama: 51%
Governor Romney: 48%
Other: 1%
Where I see the race as of today.
Version: 18
Barack Obama (D-IL) 49%
Mitt Romney (R-MA) 47%
Other Third Parties 2%
This looks more and more to be a very close, very tight presidential election. I firmly believe at this time that either Obama or Romney have a chance to win. I also think third party voting will be slightly heightened this year but not enough to cause any major disruption between the two parties. Each side has a case to make and several assumptions that it bases its campaign off of.
For the President, this election is somewhat simple. He's the incumbent that won handily in 2008. He need only maintain a majority of his previous coalition of voters and states to remain in office. To be sure he'll have his work cut out for him given his achievements and the state of the nation but it is doable. Look for Obama to focus on Virginia, Ohio, Colorado, Nevada, Florida, and other Bush '04 states he picked up in 2008.
For Governor Romney there are several possibilities in taking down an incumbent president but I believe he'll pursue a particular path. A path that we can already see emerging. But first we must understand some of the underlining assumptions.
1. States like Missouri, Arizona, and Indiana are off the table. Most know given the polarization and current polling that MO and AZ are unlikely to change their standings from last time and IN (along with NE-02) are likely to return to the GOP fold. The president's own campaign has given signals that these won't be important places and not that they'd need them in the end anyway, even in a tight race. I doubt any McCain 2008 state will give Obama its vote this time.
2. States like North Carolina and Florida, while contested, stand a decent chance of returning to the Republican column. If the race gets very close watch Romney focus on keeping them in line and Obama moving to secure places like Ohio instead. Again the president's team doesn't need a win in these places to maintain the White House. I expect North Carolina to return to the GOP and would be surprised to not see Florida there too when the election is all said and done.
3. The economic situation in the United States is highly unlike to change dramatically over the next few months barring some major event. The global scene will most likely also remain unstable with the continuing Eurozone issues, Iran, and so on and so forth. Not saying everything is static but I doubt there will be a lot of change. The economy, healthcare, and foreign policy will likely be the top issues of the campaign.
Based on these basic assumptions (all of which have been in the news at some point) I think Mitt Romney is likely to employ a Midwestern strategy, very similar to Nixon's Southern strategy. I think Romney will target middle class and working class voters in the Midwest that are fearful about the economy and the global situation in addition to growth in federal power. This is also a region that was fairly receptive to that message in 2010 and I'm betting Romney will make a play much like that. Look for Romney to target Ohio, Iowa, Wisconsin, Michigan, and Pennsylvania big time along with probably New Hampshire. That's why I think we've seen so many VP possibilities from this area - Thune, Pawlenty, Ryan, Portman, and even Ayotte (again NH is thrown in for easy here).
There are risks and assumptions here too. First of all while Romney is probably right in assuming the McCain states from 2008 and the South in general is secure he needs to make sure not to ignore either Florida or North Carolina. And he must remember to fight for Virginia. Its a winnable state, more so than Michigan or Pennsylvania and must not be forgotten about. I doubt he will but he must put many resources in here too. Most dangerous about this plan is that while maintaining the southern front and attacking the Midwest it will leave Mitt with little breathing room in the West. This can be a national campaign with a Midwestern strategy as a part of it but Romney would do well not to give up so quickly on Nevada and Colorado. If the Midwest doesn't bare fruit he'll need back ups.
Again winning scenarios are possible for both sides and right now I'd rank the race a pure tossup. I made the president the winner here as Obama currently holds narrow leads. That could change. Much to come for sure.
Version: 17
A Romney Winning Scenario
Mitt Romney (R-MA) 49.9%
Barack Obama (D-IL) 47.3%
Other 2.8%
Based on current polls, trends, and some of my own personal ideas about the 2012 campaign.
Version: 16
Barack Obama-Joe Biden (D) 50.7%
Mitt Romney-Bob McDonnell (R) 48.3%
Other Candidates (O) 1.0%
Though some may disagree I see this election returning us more to a stage akin to 2004 than 2008 or some Republican landslide. I think there is an opportunity for both candidates to win but at the moment Obama has the edge. The vote in this country is so highly polarized at this point I can hardly imagine a scenario (again at this point in time) where a close, 2004-like election does not occur.
The even the battleground states are similar. Here the election would hang on either Ohio or Pennsylvania but New Hampshire would be supremely important to the Romney camp assuming they couldn't pull off a win in Iowa, Wisconsin, or Nevada.
I'm sure the map will shift and change over the coming months but I would not be surprised if something like this (a 2004-like map) isn't the template that we all start using before too long.
Version: 15
Barack Obama-Joe Biden (D) 51%
Mitt Romney-Bob McDonnell (R) 49%
This map was generated using the Atlas' combined presidential polls on the main page as of April 13th. Obama gets every state that he currently leads in as of the date of this map's generation while Romney carries all the states where the GOP leads, is a tossup, or has no polling data but has been reliably Republican in the past.
At this point since the general election just started I think its as good a map as any. Certainly a possibility.
Version: 14
Barack Obama 52%
Republican Candidate 48%
So a little less pessimistic than my last map but still facing reality. After a long bloody primary a nominee is finally chosen either at the end of April, the end of June, or at the convention in Tampa. A majority of the center-right coalition begrudgingly unites around the GOP candidate. Gas prices become very high over the summer but not overwhelming and troubles continue in the Middle East. Overall pretty much the climate we have today more or less.
Republicans improve on their 2008 performance but fail to achieve the gains of 2010. A four point lose with mixed congressional results.
Version: 13
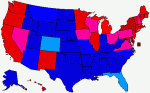
Barack Obama (D-IL) 57%
Does it really matter? (R-who cares) 43%
This is going to be an unmitigated bloodbath and it will solidify Democratic (and with that liberal/center left) control over the United States for the next generation (and not that after that amount of time will it matter since there will be no going back). Best the GOP can hope for is to barely hold the House and pick up a couple of Senate seats. Again, in the long run, not that it will matter one bit.
Someone call this game, its over.
Version: 12
Barack Obama (D-IL) 50%
Newt Gingrich (R-GA) 44%
The whole GOP primary system has been a disaster. We have a weakened, liberal president and a struggling economy and this was the best field of candidates we could come up with? By itself that was bad enough but not too terrible. No one is perfect and every candidate is flawed. However, the bloodletting over the past few months has been a sight to behold. I've tried to be positive but its been tough.
It appears at this time that the base of the GOP is going to go with Gingrich. Its really sad too because I think Newt is full of good ideas. I've enjoyed listening to many of his policy ideas in the debates. However, I don't think the American people are going to listen. His message may be good but the messenger is so flawed the perception renders him virtually unelectable. I could be wrong but I just don't see him winning a national campaign because I believe he'll make way too many missteps.
The country remains highly polarized which means I don't think Newt will get blown out of the water. In fact given the state of the country he may do better than I'm expecting as people seek change. I just don't think it will amount to enough to win the general election. With some luck the Republicans will hold the House and gain a couple more Senate seats.
I almost don't even want to watch.
Version: 11
Republican Ticket: Former Governor Mitt Romney (MA)/Governor Bob McDonnell (VA) 50%
Democratic Ticket: President Barack Obama (IL)/Vice President Joseph Biden (DE) 48%
Other: 2%
Version: 10
Republican Ticket: Former Governor Mitt Romney (MA)/Senator Marco Rubio (FL) 50%
Democratic Ticket: President Barack Obama (IL)/Vice President Joseph Biden (DE) 47%
Other: 3%
This map's just for fun! I like it because its different and a fun what if winning scenario for Romney. I'll keep it up until we know more about the GOP nominee as the primaries move along.
Version: 9
Newt Gingrich vs. Barack Obama
Version: 8
Time for some fun!
dnul has inspired me to have some fun before the primaries start and we dive into some more serious maps as the GOP selects a candidate. So here just for laughs is a potential three way race. The scenario is similar to 1992 with the American people frustrated over the economy and Washington in general plus a robust third party challenge. The tickets are as follows:
Republican: Former Governor Mitt Romney (MA)/Senator Marco Rubio (FL) 42%
Democratic: President Barack Obama/Vice President Joseph Biden (DE) 37%
Independent: Mayor Michael Bloomberg (NY)/ Former Governor Charlie Crist (FL) 21%
Version: 7
Recently there has been a lot of discussion about Newt Gingrich as he has risen in the GOP primary polls. In all honesty I have no idea how Newt would do in the general election. He has high negatives but is very good at policy work while his opponent has the power of incumbency but the drag of a miserable economy. Gingrich's negatives have started to come down as he has improved his image recently in the debates. This has lead to a rise in the polls against Obama as Republicans give Newt a second look. We can observe a similar effect in the president's approval ratings as liberals in his base return to him over a Republican. The question remains as to whether this is the start of a lasting trend or if Gingrich is just the conservatives flavor of the month so to speak.
Unfortunately because Gingrich's campaign has only come alive in the last couple of weeks there is little polling data to analyze. To make matters worse the scattering of polling data that is available ranges from mid-2010 to just this past week. This is very unreliable data since Newt's recent improved standing with the conservative base did not occur until this past month. So to create this map I've taken a slightly different approach. Some states have no polling data and so I had to guess based on past election results and others, like New York for example, were no-brainers. The rest I divided up between the following groupings:
Category 1 - These states had Gingrich keeping Obama below the 50% mark and had him within 5 points of the president. Here I believed that Newt had a strong opportunity to win these states as the GOP base comes together to oust Obama. These were usually more traditional GOP and GOP-leaning states.
Category 2 - These state had Obama at or above the 50% mark but still within 5 points of Gingrich. This particular category also features places where Obama and Gingrich tied. These are state that Newt may have a chance in. Obama is in a better position but Gingrich remains within striking distant. These are more tossup states.
Category 3 - Here are the states where Obama is at or above 50% and more than 5 points in the lead. These are the more traditional Democratic states or place in which Newt simply polls weakly.
More than a couple state had a mix of categories and were thus placed in the tossup column or lean depending on the combination. When broken down and a map generated Obama wins reelection but Newt makes a decent showing reflecting on the state of the economy. The tickets and percentages in this map are as follows.
Democratic Ticket: President Barack Obama (IL)/Vice President Joe Biden (DE) 51%
Republican Ticket: Former Speaker of the House Newt Gingrich (GA)/Governor Bob McDonnell (VA) 46%
Other: 3%
Version: 6
So far I've gone through a number of scenarios in which the various Republican candidates running for president win next year's election. Now I take a step back. I have absolutely no idea who the GOP nominee is going to be. Romney remains a constant front runner to one degree or another while Perry, Cain, and now Gingrich have cycled through the anti-Romney position for the more conservative wing of the party. President Obama is down but he's not out, not completely anyway. He faces a tough uphill battle with the economy and some of his policies. However, his polling numbers haven't bottomed out and he has the advantage of incumbency.
Therefore in the spirit of fairness I have compiled what I see to be a likely Obama victory scenario. Ultimately a nominee will be chosen by the Republican electorate but for the purposes of this map I have Obama facing a generic Republican (despite the fact that a generic Republican runs better than the actual candidates themselves against Obama). The president manages to hang onto Ohio and maintain his wins in the West while the GOP reclaims some old territory.
I know that this map has Obama winning by a smaller margin than he did in 2008. Well that was an historic election so why can't 2012 defy the odds as well. Here imagine Obama with 49% and the GOP with 47%. A tight race but one in which the president pulls off reelection.
Version: 5
Republican Ticket: Former Governor Mitt Romney (MA)/Senator Marco Rubio (FL) 49%
Democratic Ticket: President Barack Obama (IL)/Vice President Joseph Biden (DE) 47%
Other: 4%
Since the GOP primaries have been so volatile I have decided to make Romney the nominee. He currently is the Republican to be as he has the establishment backing, the money, the organization, and the campaign skills. And why wouldn't he, Mitt's been running since 2008. Until another candidate can secure enough of a position to become the clear anti-Romney in the race, I'll keep Mitt as the working nominee. Check out my primary map for more detains. Because Romney could struggle greatly with the GOP's conservative base and the Tea Party I have selected Marco Rubio, a rising conservative star, as his running mate. Other good choices could include Bob McDonnell or Bobby Jindal.
Third party races gain a larger share of the vote due to voter frustration with both parties.
Version: 4
***Please read the analysis before commenting***
Republican Ticket: Businessman Herman Cain (GA)/Governor Bob McDonnell (VA) 50%
Democratic Ticket: President Barack Obama (IL)/Vice President Joe Biden (DE) 47%
Other Parties: 1%
This is a hypothetical winning-scenario for Herman Cain should he claim the GOP nomination. I've actually been wanting to do a map like this for a while and with his recent surge in the polls I thought why not. Cain goes into the race as a fresh face from outside Washington striking a cord with those upset with government. McDonnell, the popular governor of Virginia, is chosen as his running mate to offer balance to the ticket.
Here Mr. Cain does well in the usually GOP-friendly territories of the South, Plains, and inter-mountain West. He uses a solid economic message to pick up disaffected voters in key swing states like Ohio, Virginia, Florida, and New Hampshire were frustration with the current administration is high. Its a bare-minimum win, 270 electoral votes, but it is a reasonable path to victory for just about any GOP ticket that I could envision.
Version: 3
***Please Read Analysis Before Commenting***
Republican Ticket: Governor Rick Perry (TX)/Governor Bob McDonnell (VA) 51%
Democratic Ticket: President Barack Obama (IL)/Vice President Joseph Biden (DE) 48%
Other Third Parties: 1%
I was actually inspired to do this map based on a comment that albaleman made on one of Miles' maps that if Perry were to win it would be through some sort of an Ohio-Pennsylvania column. dnul agreed that it might take just such a rust belt combination to unseat President Obama, and I got to wondering what this might look like. So here it is. Not much of a change from my last my but I like the simplicity that it offers. Again this is yet another subjective exercise until we have more data on hand. The election is still roughly 14 months away.
Some key stats for this particular scenario assumes Perry margins in the following categories:
-60% to 62% in the white vote
-around 53% to 55% of the male vote, upper 40% in the female vote
-48% to 51% in the independent vote
-38% to 40% in the moderate vote
-85% to 90% in the conservative vote
-90% to 95% in the GOP vote
-35% to 40% in the latino vote
-at or over 50% of the vote in all age groups outside of the rage of 18 to 29 years old
Version: 2
***Please read analysis thoroughly before commenting***
This map is a hypothetical winning scenario for Rick Perry. It assumes what the national stage might look like were its results based on Perry's 2010 gubernatorial win in Texas. I have, however, reduced the conservative margin as the national vote is undoubtably less conservative than Texas. The breakdown below follows with data amassed from Wikipedia, CNN exit polling, Washington Post, Gallup, and data from 2004, 2008, and 2010 (both national and Texas). Disclaimer - this is a subjective exercise.
Turnout rate estimated at 60% of the eligible voting population (2010 levels) with 1.35% voting third party. Please note some totals below will not add up to 100%.
Republican - Governor Rick Perry (TX)/ Governor Bob McDonnell (VA) 50.5% (51%)
Democratic - President Barack Obama (IL)/Vice President Joe Biden (DE) 45.8% (46%)
Margin - Perry +4.7% (5%)
Breakdown:
Race:
White (75% of total) - Perry 62%, Obama 38%
Black (12% of total) - Obama 95%, Perry 5%
Latino (9% of total) - Obama 61%, Perry 38%
Asian (2% of total) - Obama 58%, Perry 40%
Gender:
Male (48% of total) - Perry 56%, Obama 40%
Female (52% of total) - Obama 52%, Perry 47%
Party Identification:
Democratic (35% of total) - Obama 94%, Perry 5%
Republican (35% of total) - Perry 94%, Obama 5%
Independent (29% of total) - Perry 50%, Obama 40%
Ideology:
Liberal (21% of total) - Obama 90%, Perry 10%
Moderate (39% of total) - Obama 59%, Perry 40%
Conservative (40% of total) - Perry 85%, Obama 13%
Age Group:
18-29 yr old (16% of total) - Obama 54%, Perry 43%
30-44 yr old (27% of total) - Perry 51%, Obama 46%
45-64 yr old (38% of total) - Perry 54%, Obama 45%
65 yr and old (19% of total) - Perry 59%, Obama 38%
Tossup states above are based on RCP map with the exception of Michigan and North Carolina which I have moved into the lean category. States were Obama's winning 2008 percentage was below 10% have been moved into Perry's column, again a subjective exercise. I could easily have left Pennsylvania in Obama's column as well as New Hampshire (top two under 10% states) and still maintain a Perry win.
Version: 1
First prediction map for 2012
Red - Democratic President Obama
Blue - Generic Republican Candidate
Green - Tossups and Major Battlegrounds
Its still so extremely early that this is all very subjective. This is my best guess of where the race stands today, and until we get further along in the Republican primaries this is the prediction I shall keep.


 2016 President
 2016 Senate
 2016 Governor
 2014 Senate
 2014 Governor
 2013 Governor
 2012 President
 2012 Senate
 2012 Governor
 2012 Rep Primary
 2011 Governor
 2010 Senate
 2010 Governor
 2009 Governor
 2008 President
 2008 Senate
 2008 Governor
 2008 Dem Primary
 2008 Rep Primary

