


|
Date of Prediction: 2012-10-08 Version:4
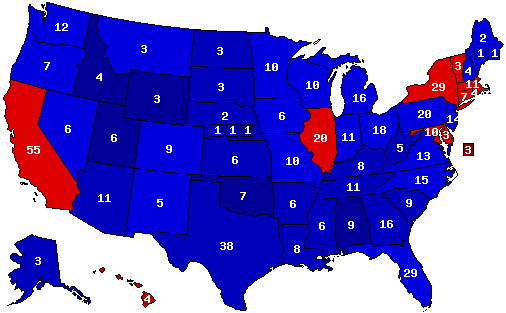
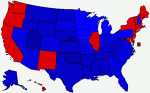
Prediction Map
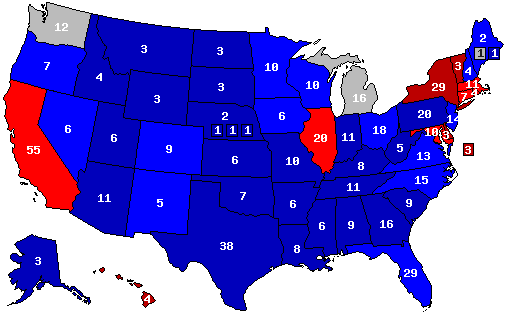
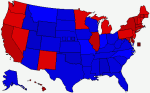
Confidence Map
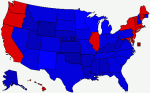
Prediction States Won
Confidence States Won
State Pick-ups
Analysis
Just for fun, here's what a 10% swing from Obama to Romney based on the 2008 results. Not very likeli but fun to look at. I'll do a 5% swing to Obama next just to be fair.
Prediction History

Comments History
- hide
Version: 6 Here's my official prediction for the election. I think campaigning will start to focus on just a few battleground states, which are most likely Ohio, Wisconsin, Iowa, Nevada, and Pennsylvania. Version: 5 Here's my analysis of what the electoral map would look like with a 5% swing to President Obama from the 2008 election. Version: 4 Just for fun, here's what a 10% swing from Obama to Romney based on the 2008 results. Not very likeli but fun to look at. I'll do a 5% swing to Obama next just to be fair. Version: 3 Here's my updated map based on a 4% swing to the Republicans from the 2008 election. Iowa, Colorado, and New Hampshire, which were won by Romney with a 5% swing, end up being won by President Obama in this scenario. A swing of 4% would result in a popular vote of Romney 49.6%, Obama 48.9%. I think based on this, Romney is more likely to lose the election while receiving more popular votes. Version: 2 This map is based on an estimated 5% swing from the 2008 election results. I didn't take into account local demographics or state polls, just a swing of 5%. Right now I'm just using the 5% as a starting point, and as I do more analysis, I'll adjust that number to see what the results are. Version: 1 This is the most likely 'tie' scenario that I could come up with for the 2012 presidential election. While it seems unlikely, I think there is a reasonable chance it could happen. Let me know what you think of this scenario or if you have alternative scenarios that you think might be likely to result in a tie. Based on the expected composition of the House, it seems likely that Romney would win the presidency in this scenario. I may come back later and do more analysis on that, though. The interesting part is that the expected composition of the Senate could result in 50 Republicans, 48 Democrats, and 2 independents that would likely caucus with the democrats. In this scenario, Vice President Biden could possibly cast the tie-breaking vote for himself as Vice President.
Version History Member Comments
User's Predictions
Links
|
|||||||||||||||||||||||||||||||||||||||||||||||||||||||||||||||||||||||||||||||||||||||||||||||||||||||||||||||||||||||||||||||||||||||||||||||||||||||||
 2012 President
 2012 Senate


Back to 2012 Presidential Prediction Home - Predictions Home