


|
Date of Prediction: 2012-10-13 Version:23
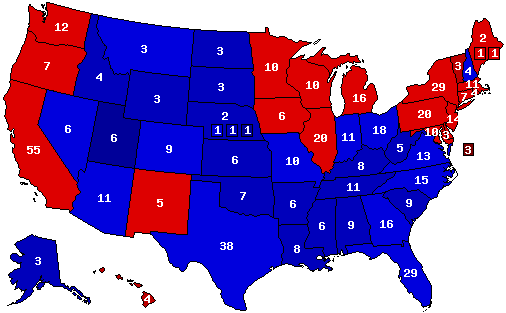
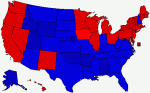
Prediction Map
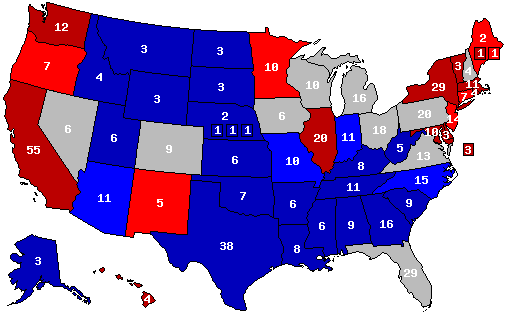
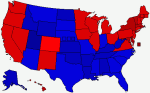
Confidence Map
Prediction States Won
Confidence States Won
State Pick-ups
Analysis
No Analysis Entered
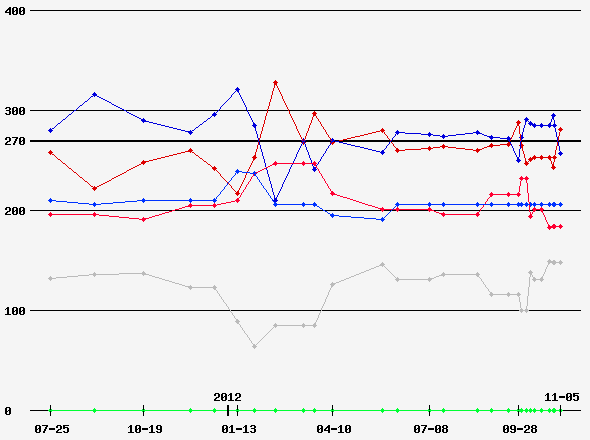
Prediction History
Comments History
- hide
Version: 15 I wasn't going to make a new prediction, but I thought there was some new polling that warranted a small adjustment. I don't think the race has really changed all the much. It is very interesting that the proverbial kitchen sink it being thrown at Romney right now and the polls are still slightly moving in his direction relative to a few weeks ago. I think the most interesting and noticable development is that the west is starting to loosen up a bit. Polling coming out of New Mexico, Colorado and Nevada is now pretty tight. I am actually a bit surprised by this. I had writted NM off this election and didn't really think Nevada and Colorado would land in the Republican column. I'm still not entirely convinced and the polls may move away from Romney out west again. What is interesting is that we are now looking at 11 toss up states. The playing field is getting bigger and bigger which is not good news for the President. He has more and more to defend and Romney's options are increasing each day. Does that mean Romney will win? Not necessarily. I just think that at this point anyone writing Romney off, despite the onslaught of attacks the past couple of weeks, should take a second look. Version: 12 Just a quick update. Not much has actually changed at this point. A momentum shift towards Romney, but still a tight race. It looks like it is all coming down to Ohio right now. Version: 6 While I have hesitated until this point to make an Obama vs. Romney map, I will capitulate for the time being. I still don't think that Romney has the nomination sewn up, and I still have my doubts as to his electability in a general election. This is where I think things stand right now, while much could change, if Romney ends up being the nominee. Version: 1 This is where I believe things stand at this point. A year and a half away from the election, it means very little.
Version History Member Comments
User's Predictions
User Info
Links
|
||||||||||||||||||||||||||||||||||||||||||||||||||||||||||||||||||||||||||||||||||||||||||||||||||||||||||||||||||||||||||||||||||||||||||||||||||||||||||||||||||||||||||||||||||||||||||||||||||||||||||||||||||||||||||||||||||||||||||||||||||||||||||||||||||||||||||||||||||||||||||||||||||||||||||||||||||||||||||||||||||||||||||||||||||||||||||||||||||||||||||||||||||||||||||||||||||


 2024 President
 2022 Senate
 2022 Governor
 2020 President
 2020 Senate
 2020 Governor
 2016 President
 2016 Senate
 2016 Governor
 2014 Senate
 2014 Governor
 2013 Governor
 2012 President
 2012 Senate
 2012 Governor
 2010 Senate
 2010 Governor
 2008 President
 2008 Senate
 2008 Governor
 2006 U.S. Senate
 2006 Governor
 2004 President


Back to 2012 Presidential Prediction Home - Predictions Home