Comments History
-
hideVersion: 37
Update 37: Colorado from R >50% to R >40%.
Iowa from R >40% to D >40%.
Ohio from D >40% to R >40%.
Version: 36
Update 36: Florida from Tossup R to Lean R.
Michigan from Tossup D to Lean D.
Pennsylvania from Strong D to Lean D.
Iowa from D >50% to R >40%.
Version: 35
Update 35: New Hampshire from D >40% to R >40%.
Version: 34
Update 34: Florida from D >40% to R >50%.
Colorado from D >50% to R >50%.
Virginia from D >50% to R >50%.
New Hampshire from D >50% to D >40%.
Ohio from D >50% to D >40%.
North Carolina from Tossup to Lean R.
Version: 32
Update 31: Florida from R >50% to D >40%.
Virginia from R >40% to D > 50%.
Wisconsin from R >40% to D >50%.
Iowa from R >40% to D >50%.
Colorado from R >40% to D >50%.
Version: 31
Update 30: Ohio from D >40% to D >50%.
Colorado from D >40% to R >40%.
Wisconsin from D >40% to R >40%.
Michigan from Lean to Tossup.
Connecticut from Strong to Lean.
Version: 30
Update 29:
North Carolina from Tossup to Lean.
Virginia from D >40% to R >40%.
Colorado from R >40% to D >40%.
Version: 29
Update 29:
Louisiana, Arkansas, Tennessee, South Dakota from R >50% to R >60%.
Virginia from R >50% to D >40%.
Iowa from D >40% to R >40%.
Colorado from D >50% to R >40%.
Wisconsin from D >50% to D >40%.
Version: 28
Update 28: Iowa from D >50% to D >40%.
Colorado from D >50% to D >40%.
Virginia from D >50% to R >50%.
Ohio from D >50% to D >40%.
North Dakota from R >50% to R >60%.
Version: 27
Update 27: Virginia from R >40% to D >50%.
Florida from R >50% to R >40%.
Iowa from R >40% to D >50%.
Colorado from D >40% to R >50%.
North Carolina from Lean to Tossup.
Version: 26
Update 26: Ohio from R >50% to D >50%.
Virginia from R >40% to R >50%.
Louisiana and Arkansas from R >60% to R >50%.
Michigan from Tossup to Lean.
Arizona from Lean to Strong.
Missouri from Lean to Strong.
Version: 25
Update 25: Virginia from D >40 to R >40.
Iowa from D >40 to R >40.
Colorado from D >50 to D >40.
Version: 24
Update 24: Virginia from R >40 to D >40.
Iowa from R >50 to D >40.
Colorado from D >40 to D >50.
Version: 23
Update 23: Colorado from R >40 to D >40.
Michigan from Lean to Tossup.
Version: 22
Update 22: Nevada from R >40% to D >50%.
New Hampshire from R >50% to D >50%.
Colorado from R >50% to R >40%.
Virginia from R >50% to R >40%.
Oregon from Strong to Lean.
Version: 21
Update 21: Nevada from R >50% to R >40%.
New Hampshire from D >50% to R >50%.
Virginia from D >50% to R >50%.
Version: 20
Update 20: Nevada from D >50% to R >50%.
Ohio from R >40% to R >50%.
Virginia from R >50% to D >50%.
Iowa from R >40% to R >50%.
Michigan from Strong to Lean.
Version: 19
Update 18: West Virginia and Kentucky from R >50% to R >60%.
Nevada from R >50% to D >50%.
New Hampshire from R >50% to D >50%.
Iowa from R >50% to R >40%.
Ohio from R >50% to R >40%.
Pennsylvania from Tossup to Lean.
Version: 18
Update 18: Nevada from D >50% to R >50%.
New Hampshire from D >50% to R >40%.
Version: 17
Update 17: Iowa from D >40% to R >50%.
Louisiana from R >50% to R >60%.
Oregon from Lean to Strong.
Indiana from Lean to Strong.
Version: 16
Update 16: New Hampshire from R >50% to D >50%.
Iowa from D >50% to D >40%.
Michigan from Lean to Strong.
Version: 15
Update 15: Colorado from R >40% to R >50%.
New Hampshire from D >40% to R >50%.
Wisconsin from D >40% to D >50%.
Louisiana, Kentucky and West Virginia from R >60% to R >50%.
Pennsylvania from Lean to Tossup.
Version: 14
Update 14: New Hampshire from R >40% to D >40%.
Montana from Lean to Strong.
Georgia from Lean to Strong.
Version: 13
Update 13: New Hampshire from R >50% to R >40%.
Iowa from D >40% to D >50%.
Colorado from D >50% to R >40%.
Version: 12
Update 12: Iowa from D >50% to D >40%.
Kentucky, Arkansas, Kansas and Louisiana from R >50% to R >60%.
Pennsylvania from Tossup to Lean.
Version: 11
Update 11: New Hampshire from R >40% to R >50%.
Wisconsin from D >50% to D >40%.
New Mexico from Strong to Lean.
Version: 10
Update 10: New Hampshire from R >50% to R >40%.
Wisconsin from Lean to Tossup.
North Carolina from Tossup to Lean.
Version: 9
Update 9: West Virginia from R >50% to R >60%.
Oregon from Strong to Lean.
Maine CD-2 from Strong to Lean.
Version: 8
Update 8: Ohio from D >50% to R >50%.
New Hampshire from R >40% to R >50%.
Version: 7
Update 7: Ohio from R >50% to D >50%.
New Hampshire from R >50% to R >40%.
Version: 6
Update 6: Ohio from R >40% to R >50%.
New Hampshire from R >40 to R >50%.
Version: 5
Update 5: Ohio from D >50% to R >40%.
New Hampshire from D >40% to R >40%.
Virginia from D >50% to R >50%.
Romney wins by an absolute whisker.
Version: 4
Update 4: Virginia from R >40% to D >50%.
New Hampshire from R >40% to D >40%.
Version: 3
Update 3: Pennsylvania now a lean, from tossup.
Ohio narrower, from D >50% to D >40%.
Version: 2
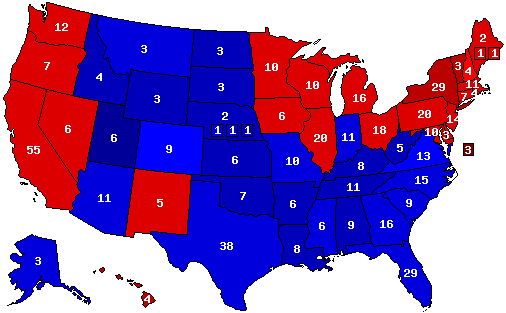
Obama wins a 1916-esque win, with Ohio putting him over the top
Version: 1
My first map!
So close, yet so far for Romney. This is where I feel the race is heading.
Obama wins a 1916-esque win, with Ohio putting him over the top.


 2016 President
 2016 Senate
 2016 Governor
 2014 Senate
 2014 Governor
 2013 Governor
 2012 President
 2012 Senate
 2012 Governor
 2012 Rep Primary


