PredictionsMock2012 Presidential Predictions - Izixs (D-NH) ResultsPolls
Note: The Google advertisement links below may advocate political positions that this site does not endorse.
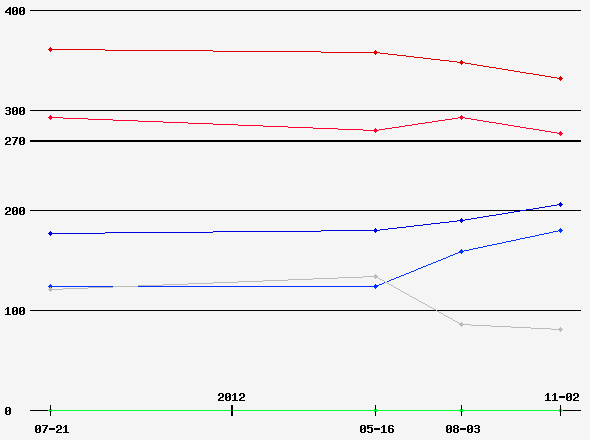
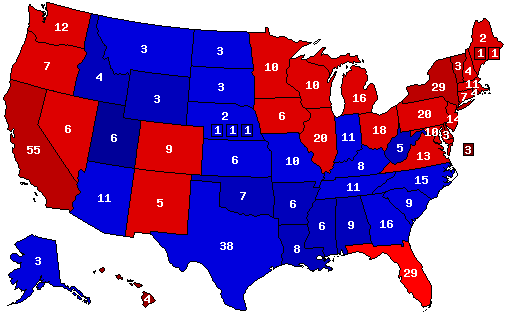
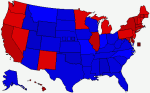
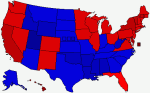
Date of Prediction: 2012-11-02 Version:4

Prediction Map
Izixs MapPrediction Key

Confidence Map
Izixs MapConfidence Key

Prediction States Won
270 |
538 |
pie
Dem332
 
Rep206
 
Ind0


Confidence States Won
270 |
538 |
pie
Dem277
 
Rep180
 
Ind0
 
Tos81
 

State Pick-ups

Gain Loss Hold Net Gain
ST CD EV ST CD EV ST CD EV
Dem000-2-1-27272332-27
Rep+2+1+27000222179+27
Ind0000000000


Prediction Score (max Score = 112)

ScoreState WinsState PercentagesCD WinsCD Percentages
105514554
piepiepiepiepie

Analysis

Only a couple flips since my last map (which was ages ago, the race has been fairly static!), with most the action being in the toss/lean map.


Prediction History
Prediction Graph


Comments History - show

Version History


Member Comments
 By: WhyteRain (I-TX) 2012-11-02 @ 22:17:23 prediction Map
Any prediction for Obama to get 330+ EVs is also a prediction that the Dems will retake the House.

The last time I looked at RCP, in its "Top 25 House Seats Most Likely To Flip" there were 10 Dem seats and 15 Repub ones -- meaning that the Dems would gain 5 seats. They need 25 to get Nancy her giant mallet back.

Last Edit: 2012-11-02 @ 22:19:48

 By: Izixs (D-NH) 2012-11-02 @ 23:00:24 prediction Map
Your declaration that a 330+ EV win yields a dem house does not necessarily follow. This is primarily due to the post 2010 redistricting where a good many states acted to shore up Republican gains in the 2010 mid terms. As such, due to gerrymandering, its much more difficult for large swings in the house and such will be true until at least mid decade, and probably later. To over come that threshold, a true land slide would be necessary for the Dems (aka 400+ EV win).

 By: WhyteRain (I-TX) 2012-11-03 @ 09:43:54 prediction Map
There were large swings in 2006 (+30 seats for the Democrats) and 2010 (+63 seats for the Repubs) -- despite the fact that Repubs dominated re-districting after the 2000 census. The Repubs are now at their highest number of Representatives since the 1947-48 Congress -- and Truman with a narrow victory in 1948 brought something like ... wait, I'll check ... 75 seats! to the Democrats.

 By: Izixs (D-NH) 2012-11-03 @ 12:38:25 prediction Map
2006, 2010, and 1948 are all elections that take place a number of years after redistricting. As such, there is plenty of time for partisan shifts to happen away from the districts gerrymandered the previous redistricting cycle. So your evidence really doesn't make any sense given the context of this election.

 By: Izixs (D-NH) 2012-11-05 @ 21:48:18 prediction Map
Hah, now 538 has caught up to my prediction! Go me!


User's Predictions

Prediction Score States Percent Total Accuracy Ver #D Rank#Pred
P 2020 President 51/56 34/56 85/112 75.9% pie 3 5 550T684
P 2020 Senate 30/35 19/35 49/70 70.0% pie 1 3 309T423
P 2020 Governor 10/11 6/11 16/22 72.7% pie 1 5 211T293
P 2018 Senate 29/35 18/35 47/70 67.1% pie 1 30 334T483
P 2016 President 46/56 23/56 69/112 61.6% pie 4 1 579T678
P 2016 Senate 29/34 16/34 45/68 66.2% pie 2 1 277T362
P 2016 Governor 8/12 4/12 12/24 50.0% pie 2 1 164T279
P 2014 Senate 27/36 14/36 41/72 56.9% pie 1 481 322T382
P 2014 Governor 24/36 11/36 35/72 48.6% pie 1 481 281T300
P 2012 President 56/56 49/56 105/112 93.8% pie 4 4 4T760
P 2012 Senate 32/33 20/33 52/66 78.8% pie 1 4 74T343
P 2012 Governor 11/11 6/11 17/22 77.3% pie 1 4 51T228
P 2012 Rep Primary 47/52 23/52 70/104 67.3% pie 27 - 5T231
P 2011 Governor 4/4 2/4 6/8 75.0% pie 1 102 12T106
P 2010 Senate 25/37 12/37 37/74 50.0% pie 4 100 418T456
P 2010 Governor 25/37 13/37 38/74 51.4% pie 2 69 248T312
P 2008 President 52/56 47/56 99/112 88.4% pie 14 1 26T1,505
P 2008 Senate 32/33 16/33 48/66 72.7% pie 2 1 172T407
P 2008 Governor 11/11 7/11 18/22 81.8% pie 2 257 50T264
P 2008 Dem Primary 40/52 19/52 59/104 56.7% pie 12 - 47T271
P 2008 Rep Primary 35/49 17/49 52/98 53.1% pie 8 - 43T235
P 2007 Governor 2/3 2/3 4/6 66.7% pie 1 87 102T167
P 2006 U.S. Senate 31/33 17/33 48/66 72.7% pie 5 15 207T465
P 2006 Governor 33/36 16/36 49/72 68.1% pie 5 12 147T312
P 2004 President 48/56 26/56 74/112 66.1% pie 20 39 1527T1,994
Aggregate Predictions 738/870 437/870 1175/1740 67.5% pie


Alabama Alaska Alaska Alaska Alaska Alaska Alaska Alaska Arizona Arkansas California California California California Colorado Connecticut Connecticut Delaware District of Columbia Florida Georgia Hawaii Hawaii Hawaii Hawaii Hawaii Hawaii Idaho Illinois Indiana Iowa Kansas Kentucky Louisiana Maine Maryland Maryland Maryland Massachusetts Michigan Michigan Minnesota Mississippi Missouri Montana Nebraska Nevada New Hampshire New Jersey New Mexico New York New York North Carolina North Dakota Ohio Oklahoma Oregon Pennsylvania Rhode Island South Carolina South Dakota Tennessee Texas Utah Vermont Virginia Virginia Washington Washington Washington West Virginia Wisconsin Wisconsin Wyoming

Back to 2012 Presidential Prediction Home - Predictions Home


Terms of Use - DCMA Policy - Privacy Policy and Cookies

© Dave Leip's Atlas of U.S. Elections, LLC 2019 All Rights Reserved