


Note: The Google advertisement links below may advocate political positions that this site does not endorse.
|
Date of Prediction: 2012-10-25 Version:9
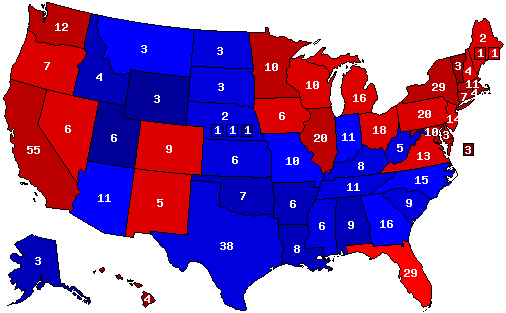
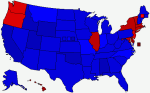
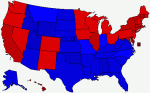
Prediction Map
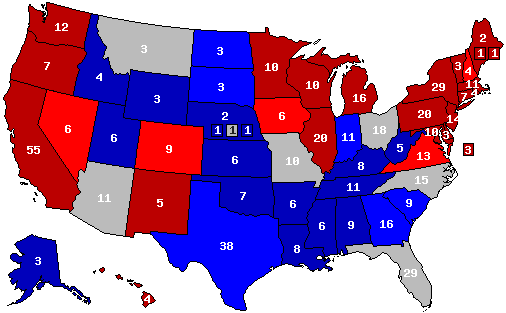
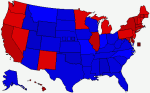
Confidence Map
Prediction States Won
Confidence States Won
State Pick-ups
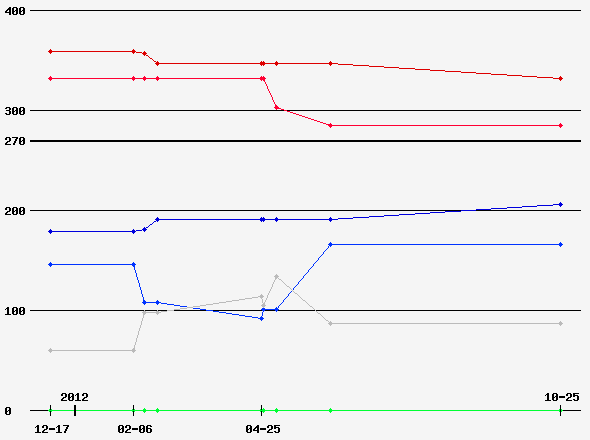
Prediction Score (max Score = 112)
Analysis
Just easing back on my prediction a bit. Romney's surge is ended and it's winding down to a stable race. FL is still on the bubble but everything else is as it was in '08 except IN and NC which have flipped back to the GOP. Pretty much the same result as the 2004 re-election of W - a 51-48 MoV for the incumbent barely hanging on despite a lot of criticism but benefitting from a lackluster challenger and a funding advantage. Dems will also retain control of the Senate with 54 and Repubs will keep the Gavel but only after giving up about 10 seats. Same conditions as now will persist for another 2 yrs, basically.
Prediction History
Comments History
- show
Version History Member Comments
User's Predictions
Links
|
||||||||||||||||||||||||||||||||||||||||||||||||||||||||||||||||||||||||||||||||||||||||||||||||||||||||||||||||||||||||||||||||||||||||||||||||||||||||||||||||||||||||||||||||||||||||||||||||||||||||||||||||||||||||||||||||||||||||||||||||||||||||||||||||||||||
 2022 Senate
 2020 President
 2020 Senate
 2016 President
 2016 Senate
 2014 Senate
 2014 Governor
 2013 Governor
 2012 President
 2012 Senate
 2012 Rep Primary


Back to 2012 Presidential Prediction Home - Predictions Home
© Dave Leip's Atlas of U.S. Elections, LLC 2019 All Rights Reserved