PredictionsMock2012 Presidential Predictions - auburntiger (I-FL) ResultsPolls
Note: The Google advertisement links below may advocate political positions that this site does not endorse.
Date of Prediction: 2012-10-23 Version:1

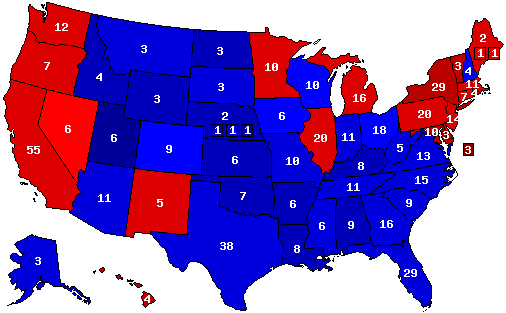
Prediction Map
auburntiger MapPrediction Key

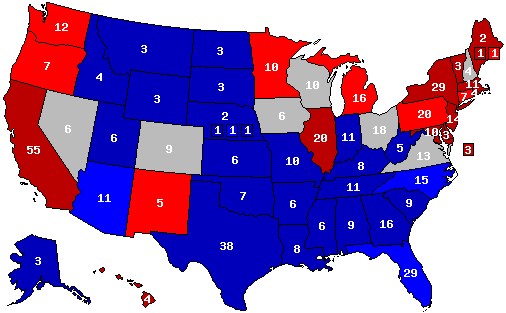
Confidence Map
auburntiger MapConfidence Key

Prediction States Won
270 |
538 |
pie
Dem243
 
Rep295
 
Ind0


Confidence States Won
270 |
538 |
pie
Dem237
 
Rep235
 
Ind0
 
Tos66
 

State Pick-ups

Gain Loss Hold Net Gain
ST CD EV ST CD EV ST CD EV
Dem000-9-1-116202243-116
Rep+9+1+116000222179+116
Ind0000000000


Prediction Score (max Score = 112)

ScoreState WinsState PercentagesCD WinsCD Percentages
85443353
piepiepiepiepie

Analysis
No Analysis Entered

Member Comments
 By: auburntiger (I-FL) 2012-10-23 @ 12:12:44 prediction Map
My best-case Romney win

 By: Snigglie (R-AL) 2012-10-23 @ 13:38:18 prediction Map
I think his best case could be better. In a wave election, Romney would likely win Nevada and have a shot at Michigan, Minnesota, Pennsylvania, and/or New Mexico.

 By: auburntiger (I-FL) 2012-10-23 @ 17:05:48 prediction Map
You could very well be right. I'm calling 235 Romney's base and 237 Obama's, but we'll have to see where the next two weeks will take us. This has indeed turned out to be an exciting campaign season.

I felt pretty bold giving Romney Ohio and Wisconsin.

 By: dnul222 (D-MN) 2012-10-23 @ 18:21:53 prediction Map
you are bold since both are still in Obama's camp by almost every poll I have seen. After this last debate we might have a small Obama boomlet (1-2% which would give him the lead in some of the swing states....most difficult are North Carolina, Florida and then Virginia and COlorado....all these I oculd see going to Romney easily...Iowa is tougher as more people have already voted there and if polls are right heavily for Obama...

 By: auburntiger (I-FL) 2012-10-26 @ 12:28:22 prediction Map
Thanks for your analyss, dnul.
Two reasons I feel like Romney will win is 1) the economy is the most important issue on people's minds.
2) only in 1916 did a sitting president win re-election to a 2nd term with fewer electoral votes than the 1st; however, there has not been one that I know of where a president gets fewer popular votes AND electoral votes and still wins.

I had said on an a thread earlier maybe back in september where we're most likely to see a narrow Obama loss or a bigger Obama win. That was before the first debate had happened.

I know that state polls are all over the place right now, but nationally, romney has been at 50% in quite a few whereas Obama has not.

I'm not saying that anyone has this thing in the bag, as you look at my tossups.

 By: CR (--MO) 2012-10-26 @ 23:43:46 prediction Map
This would be the map I'd prefer to see on election night. It's my hope actually. I'd be feeling pretty good come November 7th. We'll see.

 By: WhyteRain (I-TX) 2012-10-27 @ 10:18:20 prediction Map
NH and VA will be among the earliest reporting states. If, as this map shows, the same candidate (Romney in this case) wins BOTH, then I think you can turn off the TV and go to bed.

P.S. We HAVE to get rid of "early voting". Voters should make their decisions with us all having the SAME information.


User's Predictions

Prediction Score States Percent Total Accuracy Ver #D Rank#Pred
P 2024 President /56 /56 /112 % pie 246
P 2022 Senate 30/35 19/35 49/70 70.0% pie 1 4 271T305
P 2022 Governor 31/36 20/36 51/72 70.8% pie 1 4 228T272
P 2020 President 48/56 37/56 85/112 75.9% pie 1 356 550T684
P 2020 Senate 31/35 20/35 51/70 72.9% pie 1 292 241T423
P 2020 Governor 11/11 6/11 17/22 77.3% pie 1 294 147T293
P 2018 Senate 33/35 19/35 52/70 74.3% pie 7 23 170T483
P 2018 Governor 32/36 21/36 53/72 73.6% pie 5 25 164T372
P 2016 President 51/56 32/56 83/112 74.1% pie 1 24 114T678
P 2016 Senate /34 /34 /68 0.0% pie 2457701 362
P 2016 Governor 10/12 3/12 13/24 54.2% pie 1 24 119T279
P 2014 Senate 34/36 26/36 60/72 83.3% pie 5 1 21T382
P 2014 Governor 30/36 16/36 46/72 63.9% pie 5 1 123T300
P 2012 President 49/56 36/56 85/112 75.9% pie 1 14 614T760
P 2012 Senate 27/33 13/33 40/66 60.6% pie 1 14 252T343
P 2012 Governor 8/11 4/11 12/22 54.5% pie 1 14 196T228
P 2010 Senate 33/37 22/37 55/74 74.3% pie 13 1 133T456
P 2010 Governor 33/37 24/37 57/74 77.0% pie 7 1 91T312
P 2009 Governor 1/2 1/2 2/4 50.0% pie 3 7 56T103
P 2008 President 53/56 42/56 95/112 84.8% pie 20 29 100T1,505
P 2008 Senate 32/33 13/33 45/66 68.2% pie 2 33 257T407
P 2008 Governor 10/11 4/11 14/22 63.6% pie 4 33 212T264
P 2008 Dem Primary 40/52 1/52 41/104 39.4% pie 6 - 99T271
P 2008 Rep Primary 42/49 6/49 48/98 49.0% pie 8 - 63235
P 2006 U.S. Senate 32/33 15/33 47/66 71.2% pie 6 1 232T465
P 2006 Governor 33/36 12/36 45/72 62.5% pie 5 1 207T312
Aggregate Predictions 734/864 412/864 1146/1728 66.3% pie


Alabama Alaska Alaska Alaska Alaska Alaska Alaska Alaska Arizona Arkansas California California California California Colorado Connecticut Connecticut Delaware District of Columbia Florida Georgia Hawaii Hawaii Hawaii Hawaii Hawaii Hawaii Idaho Illinois Indiana Iowa Kansas Kentucky Louisiana Maine Maryland Maryland Maryland Massachusetts Michigan Michigan Minnesota Mississippi Missouri Montana Nebraska Nevada New Hampshire New Jersey New Mexico New York New York North Carolina North Dakota Ohio Oklahoma Oregon Pennsylvania Rhode Island South Carolina South Dakota Tennessee Texas Utah Vermont Virginia Virginia Washington Washington Washington West Virginia Wisconsin Wisconsin Wyoming

Back to 2012 Presidential Prediction Home - Predictions Home


Terms of Use - DCMA Policy - Privacy Policy and Cookies

© Dave Leip's Atlas of U.S. Elections, LLC 2019 All Rights Reserved