


Note: The Google advertisement links below may advocate political positions that this site does not endorse.
|
Date of Prediction: 2012-11-06 Version:2
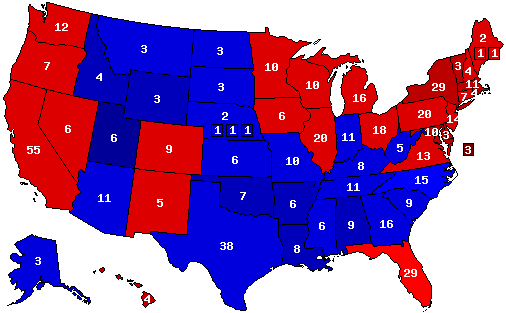
Prediction Map
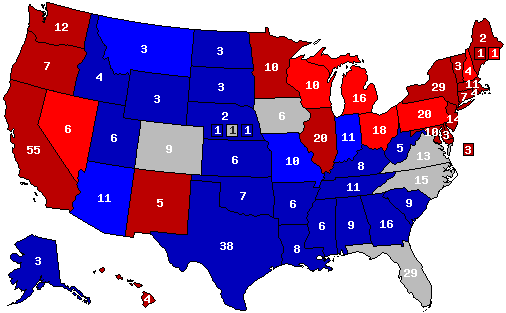
Confidence Map
Prediction States Won
Confidence States Won
State Pick-ups
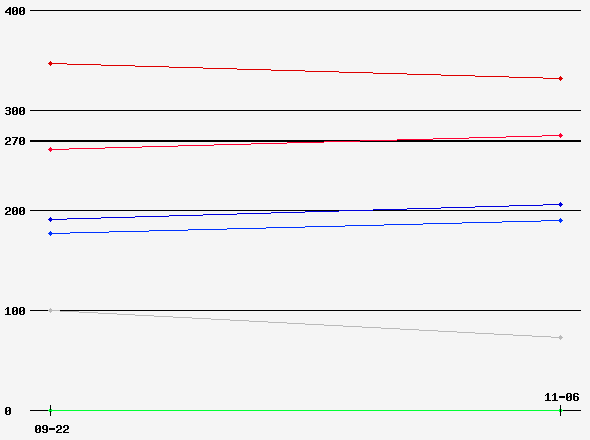
Prediction Score (max Score = 112)
Analysis
I don't have any surprises here compared to the conventional wisdom. I'm pretty confident in how most of the toss-ups will eventually vote. However, Florida and North Carolina give me the most trouble. I think they'll be the closest and both could go either way. It'll all come down to the ground game and how strong the organizations are, which could very well end up giving President Obama a higher electoral count (the realistic max being 347-348). At the least, I see the President matching President Bush's popular vote margin from 2004, probably right around a 3% lead or so.
Prediction History
Comments History
- show
Version History Member Comments User's Predictions
User Info
Links
|
|||||||||||||||||||||||||||||||||||||||||||||||||||||||||||||||||||||||||||||||||||||||||||||||||||||||||||||||||||||||||||||||||||||||||||||||||||||||||||||||||||||||||||||||||||||||||||||||||||||||||||||||||||||||||||||||||||||||||||||||||||||||||||||||||||||||||||||||||||||||||||||||||||||||||||||||||||||||||||||||||||||||||||||||||||||||||||||||||||||||||||||||||
 2022 Senate
 2022 Governor
 2020 President
 2020 Senate
 2020 Governor
 2016 President
 2016 Senate
 2016 Governor
 2014 Governor
 2013 Governor
 2012 President
 2012 Senate
 2012 Governor
 2010 Senate
 2010 Governor
 2008 President
 2008 Senate
 2008 Governor
 2007 Governor
 2006 U.S. Senate
 2006 Governor


Back to 2012 Presidential Prediction Home - Predictions Home
© Dave Leip's Atlas of U.S. Elections, LLC 2019 All Rights Reserved