


|
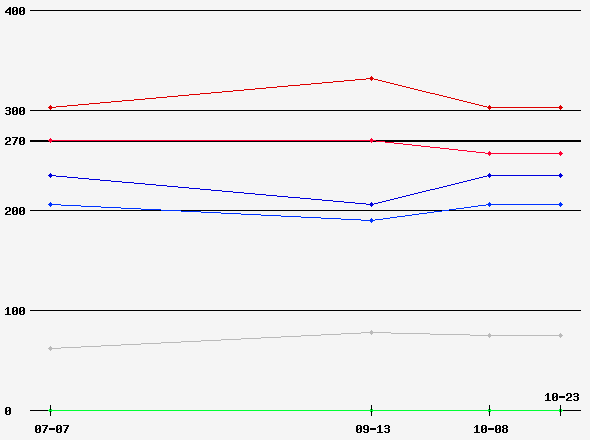
Date of Prediction: 2012-10-23 Version:4
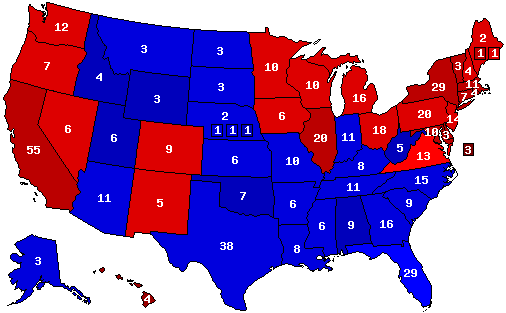
Prediction Map
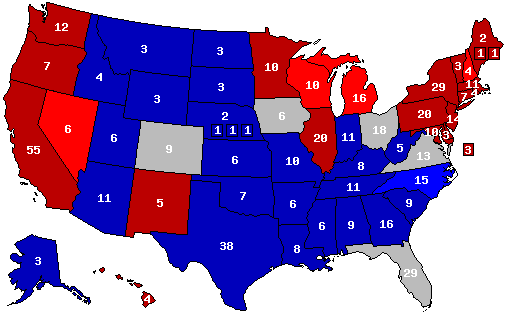
Confidence Map
Prediction States Won
Confidence States Won
State Pick-ups
Prediction Score (max Score = 112)
Analysis
Mostly just moved states off the "leaner" category into "strong" New Mexico moved to strong Obama, Missouri moved to strong Romney, Indiana moved to strong Romney.
Prediction History
Comments History
- show
Version History Member Comments User's Predictions
Links
|
||||||||||||||||||||||||||||||||||||||||||||||||||||||||||||||||||||||||||||||||||||||||||||||||||||||||||||||||||||||||||||||||||||||||||||||||||||||||||||||||||||||||||||||||||||||||||||||||||||||||||||||||||||||||||||||||||||||||||||||||||||||||||||||||||||||||||||||||||||||||||||||||||
 2020 President
 2020 Senate
 2016 President
 2016 Senate
 2014 Senate
 2012 President
 2012 Senate
 2010 Senate
 2010 Governor
 2008 President
 2008 Senate
 2008 Governor
 2006 U.S. Senate
 2006 Governor


Back to 2012 Presidential Prediction Home - Predictions Home