


|
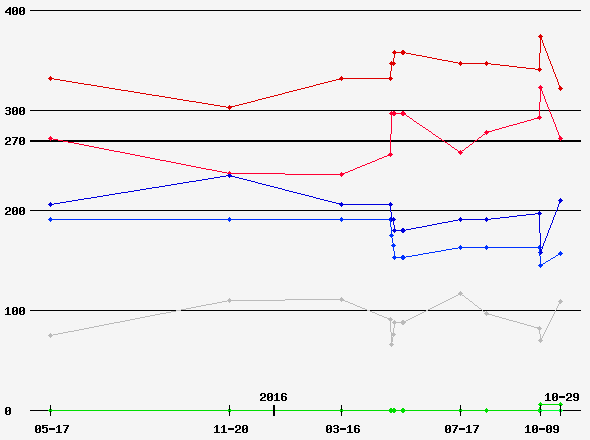
Date of Prediction: 2016-10-29 Version:14
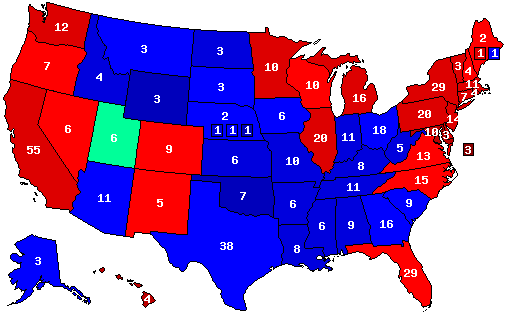
Prediction Map
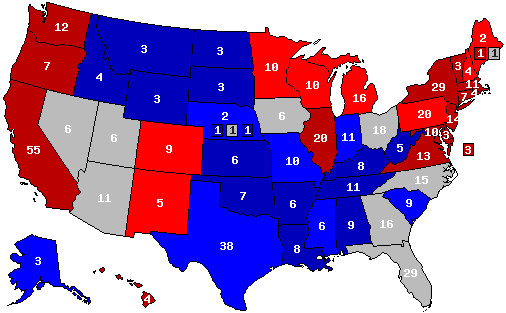
Confidence Map
Prediction States Won
Confidence States Won
State Pick-ups
Prediction Score (max Score = 112)
Analysis
Looked over every contest today. Between Johnson's expectable collapse and the slight pullback in Clinton's fortune, my map is looking rosier for Trump, but still not rosy enuf to be a win, just not as crushing a defeat as it could have been for him. Last time Utah in the I column was a placeholder for Trump 20%, now it truly is McMullin 30%.
Prediction History
Comments History
- hide
Version: 13 The wholesale abandonment of Trump by significant parts of the GOP establishment since I posted by prediction yesterday led me to do this. Utah is now in the Independent column, but if it truly were an option, I'd have Trump at the 20% decile right now. Version: 12 While Clinton has strengthened since September, I last updated this map in August, so it actually is an improvement for Trump. However, since my prediction back in August was rather strongly pro-Clinton for then, even the slight improvement for Trump is nothing Trumpsters should cheer. This is even more apparent when you look at the non-tossup EVs, where I have Clinton gaining since my last prediction. Percentage margins overall have been reduced as Johnson has proven to be much stronger than I expected. That said, he'll need to overcome the option I suspect many disgruntled voters will take, that of not voting for anyone for President. However, he might hit the 5% target he's hoping for. Version: 11 No states that flipped, with me having Trump stronger in a state or two, but by and large, the changes since I last did this are in Clinton's favor. Version: 10 This is a combination of a slight shift away from Clinton and a strengthening of likely third party prospects since my last prediction. Version: 9 In New Mexico, I'm gonna be bullish enuf on Johnson to reduce Clinton to 40% while simultaneously predicting she'll strongly beat Trump by ten or more points. Version: 8 Decided to move New Hampshire from Strong D to Lean D as the polling doesn't support a double digit Donald defeat. Version: 7 Did the remainder of the west to finish my post clinch review. Moved Arizona from 50% Lean R to 40% Tossup D based on the expect strength of the Libertarians there. More mundane changes are Colorado from Lean D to Strong D, Alaska and Montana from Strong R to Lean R, Nebraska at-large from 60% R to 50% R. Nebraska-2 from 50% Lean R to 40% Tossup R and Nebraska-3 from 70% R to 60% R. Version: 6 Miniupdate 3, the five states just west of the Mississippi. I moved Minnesota from Lean D to Strong D, Missouri from Lean R to tossup R, and in my first pro-Trump change of this cycle of updates, Iowa from 50% D to 40% D. Version: 5 Update 2. Adding the remaining States east of the Mississippi to my post-clinch analysis. Changing Alabama and Tennessee from 60% R to 50% R, Delaware and Illinois from 50%D to 60% D, Georgia from Lean R to Tossup R, Kentucky from Strong R to Lean R, North Carolina from 50% R to 40% D, and Ohio, Virginia, and Wisconsin from Tossup D to Lean D. All changes are one step towards Hillary, except in North Carolina. I think the blowback from HB 2 will be enuf to make what would otherwise be a 40% R state into a 40% D state. Version: 4 Phase 1 of updating now that the candidates are set for sure. Looked over the nine northeastern States and moved Massachusetts to 60%, up from 50%, New Jersey from Lean D to Strong D, and Pennsylvania from Tossup D to Lean D. Version: 3 I think that most likely we will see TRUMP v. Clinton. This far out, I am willing to tweak a few states, but not by much based on the candidates. The states where margins are most likely to be affected by TRUMP being the nominee are ones that are safe D or R. I cannot see TRUMP affecting the battleground states much with the exception of Wisconsin (helps R) and Florida (hurts R). Far more significant will be traditional national concerns such as the economy and there the continuing albeit sluggish recovery suggests not much change from 2012 with possibly a slight boost overall for the Democrats the longer this recovery continues. Version: 2 Still too early to make firm predictions, but both the economy and foreign affairs have had enough of an impact since May that I feel that the tenor has changed from a slight Democratic improvement to a slight Republican improvement. At the level of who wins or loses, all this changes for me is that I no longer see Florida as a Democratic pickup, leaving a map essentially unchanged from 2012.<br /> <br /> Here's the detailed list of what I changed:<br /> Arkansas R50 to R60<br /> Colorado Lean to Tossup<br /> Florida D50 to R40<br /> Indiana Lean to Strong<br /> Iowa Lean to Tossup<br /> Kansas R50 to R60<br /> Maine CD1 D60 to D50<br /> Michigan Strong to Lean<br /> Nebraska At-Large R50 to R60<br /> Nebraska CD3 R60 to R70<br /> North Dakota R50 to R60<br /> Ohio D50 to D40<br /> Pennsylvania Lean to Tossup<br /> Tennessee R50 to R60 Version: 1 Initial prediction. Overall, sightly more Democratic than 2012, as it looks the economy will be better in 2016 than in 2012, and I think there will be a fair number of voters in favor of divided government who will rightly assume the GOP retains control of Congress. This far out, more specific predictions are fairly idiotic, and will continue to be until it's reasonably clear who the GOP will nominate. I don't expect to make another prediction this year unless a major event roils US politics.
Version History Member Comments User's Predictions
User Info
Links
|
|||||||||||||||||||||||||||||||||||||||||||||||||||||||||||||||||||||||||||||||||||||||||||||||||||||||||||||||||||||||||||||||||||||||||||||||||||||||||||||||||||||||||||||||||||||||||||||||||||||||||||||||||||||||||||||||||||||||||||||||||||||||||||||||||||||||||||||||||||||||||||||||||||||||||||||||||||||||||||||||||||||

 2020 President
 2020 Senate
 2018 Senate
 2016 President
 2016 Senate
 2013 Governor
 2012 President
 2012 Senate
 2012 Governor
 2012 Rep Primary
 2010 Senate
 2010 Governor
 2009 Governor
 2008 President
 2006 U.S. Senate
 2006 Governor
 2004 President


Back to 2016 Presidential Prediction Home - Predictions Home