


|
Date of Prediction: 2016-11-08 Version:1
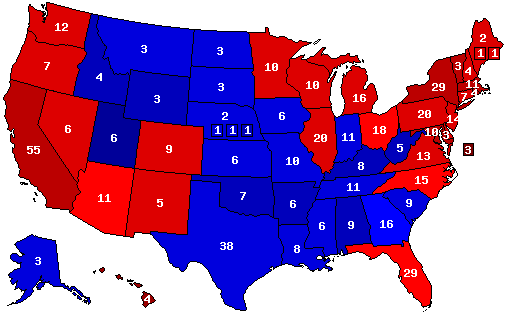
Prediction Map
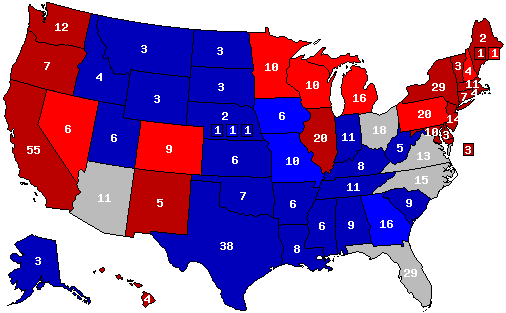
Confidence Map
Prediction States Won
Confidence States Won
State Pick-ups
Prediction Score (max Score = 112)
Analysis
This ugly and unique campaign season has finally(and mercifully) come to an end. Trump's last hope based on Hillary's emails, which was sparked by Comey's unprecedented statement inserting himself into the campaign, has been squashed by Comey himself<br /> saying there was nothing illegal about the e-mails. Any last-last<br /> minute momentum therefore goes to Hillary, for what it is worth.<br /> The race goes back to its usual paradigm, which is Hillary holding<br /> a solid lead in the popular vote. This is based on her over-performing on the basis of Blacks, Latinos, Asians, and White college-educated people. Trump in turn is over-performing among the White non-college educated, but that is not enough compensation; there simply aren't enough of them. The Latino population has been growing rapidly for decades, and now they will<br /> start voting in percentages closer to Whites and Blacks. Asians are also a rapidly growing population, and have tended to vote heavily<br /> for Democrats, further adding to Trump's problems. In the electoral college, the closest states should be Arizona and Ohio, with Latinos in Arizona and Blacks in Ohio giving Hillary a very narrow win in each state. Member Comments User's Predictions
Links
|
||||||||||||||||||||||||||||||||||||||||||||||||||||||||||||||||||||||||||||||||||||||||||||||||||||||||||||||||||||||||||||||||||||||||||||||||||||||||||||||||||||||||||||||||||||||||||||||||||||||||||

 2016 President
 2014 Senate
 2014 Governor
 2012 President
 2010 Senate
 2008 President


Back to 2016 Presidential Prediction Home - Predictions Home