


|
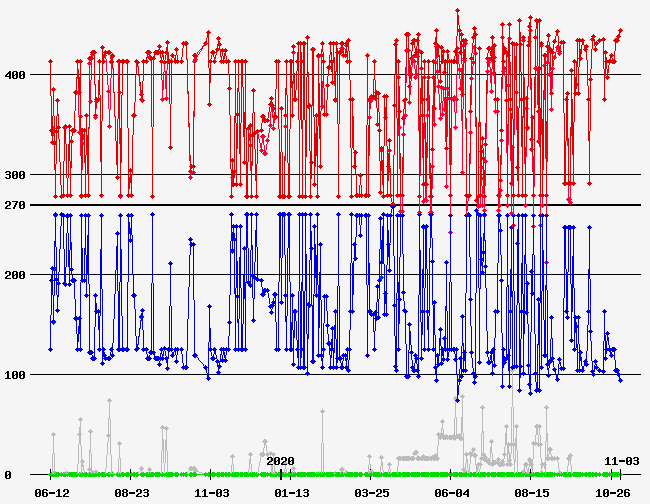
Date of Prediction: 2020-10-27 Version:436
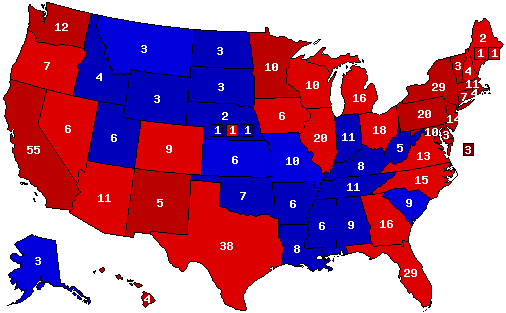
Prediction Map
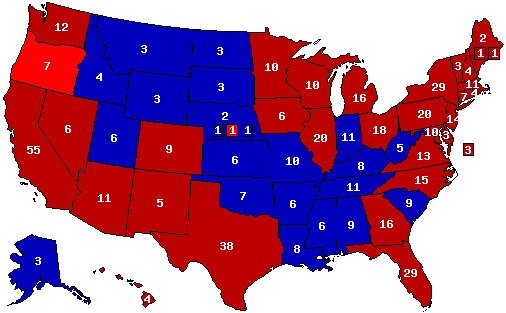
Confidence Map
Prediction States Won
Confidence States Won
State Pick-ups
Analysis
No Analysis Entered
Prediction History
Comments History
- hide
Version: 438 Prez Biden and Veep Harris Version: 428 Prez Biden Version: 410 291-47 EC map and 51/49 Senate Version: 366 C Version: 348 268 EC blue wall<br />rn<br />rnMLG Veep Version: 330 46th Prez Biden/Liz Warren and 50/50 Senate Version: 310 46th Prez Biden/Abrams Version: 230 Coronavirus makes it once again a 279 tace Version: 207 RIP TRUMP Version: 206 RIP TRUMP Version: 193 46th Prez Bernie/Klobuchar & AG Harris 412<br />rnTrump/Pence 125 51/47 Version: 124 END CITIZENS UNITED Version: 123 Biden-4-Prez-Vets 4 Truth Version: 119 Biden-4-Prez Version: 115 Warren-4-prez Version: 113 BIDEN-GILLIBRAND-4-PREZ Version: 108 Secular trifecta Version: 103 Wealth tax on wealthy; as a result of, Warren/Castro securing 278 freiwal and Dem Trifecta Version: 81 Defeat of Trump and Senate Leader McConnell inevitable Version: 35 Gross, Kelly, Jones, Romanoff, Grissom, Gideon, Cunningham & Harrison-4-freshman class of Sen 2020 Version: 34 Endorse:Gross, Romanoff, Grissom, Gideon, Cunningham, Harrison-4-2020 sen freshman class Version: 32 Biden-Ryan map Version: 17 Kamala/Beto-4-Prez Version: 15 HARRIS/BETO 70M to 66M Version: 2 Trump loses OH and loses the election
Version History Member Comments User's Predictions
Links
|
|||||||||||||||||||||||||||||||||||||||||||||||||||||||||||||||||||||||||||||||||||||||||||||||||||||||||||||||||||||||||||||||||||||||||||||||||||||||||||||||||||||||||||||||||||||||||||||||||||||||||||||||||||||||||||||||||||||||||||||||||||||||||||||||||||||||||||||||||||||||||||||||||||||||||||||||||||||||||||||||||||||||||||||||||||||||||||||||||||||||||||||||||||||||||||||||||||||||||||||||||||||||||||||||||||||||||||||||||||||||||||||||||||||||||||||||||||||||||||||||||||||||||||||||||||||||||||||||||||||
 2024 President
 2023 Governor
 2022 Senate
 2022 Governor
 2021 Governor
 2020 President
 2020 Senate
 2020 Governor
 2019 Governor
 2018 Senate
 2018 Governor
 2017 Governor
 2016 President
 2016 Senate
 2016 Governor
 2015 Governor
 2014 Senate
 2014 Governor
 2013 Governor
 2012 President
 2012 Senate
 2012 Governor
 2012 Rep Primary
 2011 Governor
 2010 Senate
 2010 Governor
 2009 Governor
 2008 President
 2008 Senate
 2008 Governor
 2008 Dem Primary
 2008 Rep Primary
 2007 Governor
 2006 U.S. Senate
 2006 Governor
 2004 President


Back to 2020 Presidential Prediction Home - Predictions Home