


|
Date of Prediction: 2020-11-02 Version:18
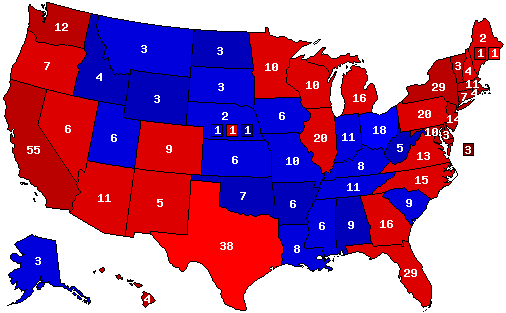
Prediction Map
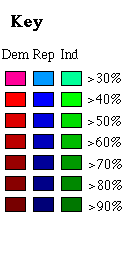
Confidence Map
Prediction States Won
Confidence States Won
State Pick-ups
Prediction Score (max Score = 112)
Analysis
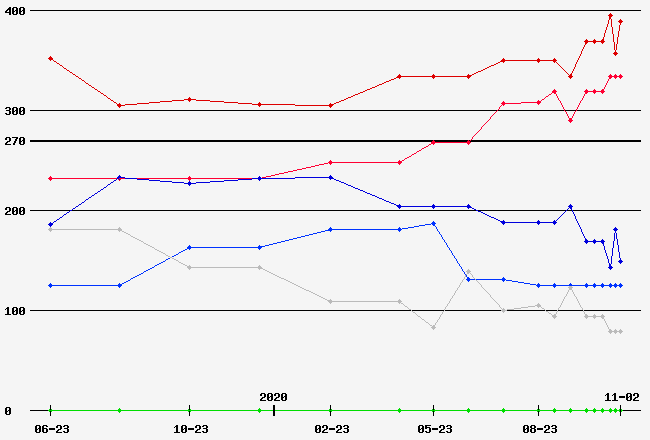
Well, this is it, my final presidential election forecast for 2020. There seems to be little change in the electoral situation relative to where things stood last week, and thus there are few changes for this map. While the national polls have narrowed *maybe* half a point or so in the last week, and even this small movement looks like it is simply due to pollster herding, the state polls - which have a history of being more accurate - are showing no similar movement. Joe Biden's lead in this race appears to be around 9% nationally, and some analysis I did earlier tonight actually makes me more confident in a final margin at least fairly close to that number than I was previously. I took the time to look back at the state polling in 2016, and what each state's polls implied about the final national margin that year: Trump's polling leads at the end of the 2016 campaign in Iowa and Ohio were both large enough as to suggest he would actually win the national popular vote - by about 5% and 1% respectively - if the national swing had been uniform, and a number of other states like New Hampshire also suggested a much closer race than what the final national polls suggested. These polls should have been a warning sign that politically similar states like Michigan, Wisconsin, Pennsylvania, and Maine could be closer than the polls there were suggesting, and indeed that is exactly what ended up happening. After reviewing similar data for this year in states with a large number of polls, I see no similar warning signs this year. The worst implied result for Biden is if the national vote is similar to what the polls in Florida indicate, which would still be around a 6% margin nationally - such a result would still be large enough that an inversion between the winner of national vote and the electoral college would be quite unlikely. On the other side of things, some states actually suggest a larger national win for Biden than the 9% that is showing up in the average: Biden's polling lead in New Hampshire, for instance, would imply something like a 12.5% lead nationally, which would essentially guarantee a Biden landslide in the electoral college, and other states like Michigan, Wisconsin, and Texas also suggest a double-digit national win for Biden. I do not mean to suggest by any of this that it is impossible for Trump to win the election - obviously it is essential that voters who have not yet cast their ballots actually turn out to vote tomorrow, and that they don't stay home out of a sense of complacency - but if Trump were somehow to win it would be genuinely an out-of-nowhere shock without any evidence in advance, rather than a case like 2016 where the warning signs were present but went ignored by most analysts. Now, with all of that out of the way, I will address the two changes I have made for this final map, as well as a few other states that did not change, but which remain important. First, I have switched Iowa from a narrow Biden win to a narrow Trump win. The polls had already been close there, and Iowa was a state I was never super comfortable having in the Biden column due to what I know of the trends in how votes have shifted in the years since the 2016 election - Democrats have generally been making their largest gains in the suburbs of large metro areas, while Iowa is a very rural state. As such, when the Des Moines Register poll came out a few days ago with Trump ahead substantially there, it was a very easy call for me to switch the state back to a Trump lead - though I do think it will be a closer final margin than the margin in that singular poll, hence the continued Tossup status. Finally, I have made the - perhaps ill-advised - decision to switch Texas back to a Biden victory. As I have said before, this is a state where I think Biden has a pretty good chance to beat his polls, given that the absolutely enormous early vote there has already guaranteed a record-breaking final vote turnout - notably we are seeing especially large turnout increases in the aforementioned suburbs where we know Democrats have improved their standing most relative to 2016 - and thus there is a higher than usual chance that the likely voter screens that most polls use will end up being too restrictive, missing many voters. Trump currently retains a very narrow lead in the polling there - exactly 1% in the FiveThirtyEight average at this moment - but that is close enough for me to go out on a limb and put Biden narrowly ahead in my prediction. This was not an easy decision, given the enormous implications it has for the electoral college totals, and I do think Texas is not much beyond a pure 50-50 coin flip, but this is my most intellectually honest view of the situation. As for other states: I did contemplate moving both Florida and North Carolina to Tossup status, but enough polling has come out in the last few days that I have to conclude that both states still fit my Lean classification description, in that the balance of the evidence suggests that one candidate (Biden) is ahead by a consistent but modest margin. Trump could still end up winning both states in a situation where he beats his polls, but they are far enough from being pure coin-flips that I can't say that a Tossup status is justified - even in spite of my natural inclination to be even more skeptical of Florida than most states. Finally, I have spent a lot of time thinking about Pennsylvania as well, but ultimately all of the credible polling here remains consistent with a decent Biden win - probably somewhere in the neighborhood of 5-6% at the end. Additionally, after reviewing mail ballot return rates for Pennsylvania, which has been a source of great concern in the press, I think it is reasonable to say that if somehow there were a court decision against counting mail ballots that arrive after election day, only about 0.5% of Biden's state margin could realistically be at risk, which is less than what some of the current fears circulating would suggest, and thus I remain comfortable with a final rating for Pennsylvania of Likely Biden. This leaves a national situation with an unusually large range of likely final outcomes, ranging from somewhere between a narrow Biden win with 279 electoral votes (If Trump beats his polls by realistic margins: Repeating what I said earlier, an usually large polling miss where Trump somehow wins Pennsylvania is not impossible, just unlikely) to a landslide Biden win with 413 electoral votes (And maybe more if Biden beats his polls by an unusually large margin). I hope those who have viewed these predictions feel more informed by having looked at them, and I conclude this year as I conclude every single presidential election prediction here, though with some added urgency given the national crisis we are in. If you are an American, and you think it matters how this country is governed, and if you haven't already done so, please: VOTE
Prediction History
Comments History
- hide
Version: 17 Five days until the 2020 presidential election, and I present to you my penultimate forecast for this cycle. There were several changes I contemplated making for this map, but I ended up only going through with three, as I concluded that most of what I was seeing was probably just noise in the data. With the campaign rapidly approaching its conclusion, I decided this would be as good a time as ever to discuss things from an overall perspective, and to give an (extensive) walk-through of my thought process on how I make these prediction maps and what the different confidence levels I use actually mean from a practical standpoint. I tend to be pretty data-driven in how I look at things: I rely mostly on a combination of head-to-head election polling, approval/favorability polling for the candidates, and - especially for states where there isn't much polling - historical elections data. I'm pretty cautious about looking at the early vote in most cases - I've made poor decisions based on reports about early voting before, including in the last presidential election, though I do think it can be somewhat informative in certain extreme circumstances - and I'm generally skeptical about anecdotal reports about turnout or voter enthusiasm as well. I know a lot of people are skeptical of polling after what happened in 2016, but historically polling is better for forecasting elections than things like economic data or yard signs or crowd sizes or whatever other tangentially-related metric people sometimes look to for guidance. Additionally, now that we are approaching the very end of the race, I'm paying extra attention to news stories on the nightly national news programs, so as to be conscious of what issues any remaining undecided voters will likely be thinking about, and considering the implications for how that may influence their final voting decision - though with how few undecided voters are left, this effect is likely to be small this year. Overall, the head-to-head polling nationally, in the states, and at the congressional district level (something I did not consider in prior presidential elections, but which can actually be quite helpful in spotting potential warning signs of polling error at other levels, as it did in 2016) is all pretty clearly in agreement that Joe Biden is in the lead nationally, probably by around 9 percentage points, and if anything the district-level polling may suggest a somewhat larger lead than that. All of this is also consistent with what we are seeing in candidate favorability and approval polling (another warning sign for the Clinton campaign that I didn't consider enough in 2016), where Donald Trump's job approval remains below any previous president who was re-elected in the era of modern, frequent polling. The news cycle at this moment is also unlikely to provide any last-minute reprieve for Trump in the way it did in 2016, as the dominant news story remains - as I have been saying it likely would since July - the coronavirus pandemic and this administration's catastrophic response to it, as new case totals are rapidly approaching 90 thousand per day in what is clearly a new third spike. To take all of that into consideration and summarize: While strange things do sometimes happen, and while there is plenty of evidence that Trump's situation in the electoral college is not *quite* as dire as it is in the national popular vote, this is, very simply, an election where the evidence is pretty consistently pointing toward a Biden victory next Tuesday, and likely a fairly large victory. As for the confidence levels, without getting into the messiness of probability and statistics, here is my general guide to how you should think about how I classify things. Tossup states are just what you would expect them to be, they are states where the evidence does not suggest a clear leader by any significant margin. While there may be a slight tilt in one direction or the other - for example I would consider Georgia to be tilting toward Biden at this point - tossup states are mostly just educated guesses. The tossup state of Texas was by far the hardest to settle on a winner for on this map, which I have for now switched back to a Trump victory, but it really does feel like basically a pure coin flip there - notably it is a state where the district polling looks a bit better for Biden than the statewide polling, though a lot of that is internal polling and there is reason to be especially careful when dealing with internal numbers. Lean states are obviously a bit more confident, but while the evidence does suggest one candidate is ahead, it is usually only by a fairly modest margin, and an upset victory by the other candidate would not be all that surprising. There is one shift in this category for this map, as I have moved Montana from Likely Trump to Lean Trump. While Trump's polling margin in that state is a bit larger than what would normally be expected for a lean state, the polls have been getting better for Biden there, there is a severe coronavirus outbreak going on there that could be expected to produce a significant shift in the race, and Trump's state approval rating data suggests there is some underlying weakness that could result in a surprise. The next categories of states, Likely Biden and Likely Trump, are unfortunately lumped into the strong classifications on the map itself due to map limitations, but I'll list them here for the sake of completeness: Michigan, Minnesota, New Hampshire, Nevada, Pennsylvania, Wisconsin, and the 2nd Congressional District in Nebraska (my final change for this map) are races I would consider Likely Biden, while Indiana, Kansas, Missouri, South Carolina, and Utah are races I would consider Likely Trump. Some of these are races where the data generally points in the same direction, like Michigan, while others are states that haven't been polled much and some of the data points to a closer race than other data, like Kansas and Utah, but all fall into the category of states where the evidence when considered together suggests that one candidate is ahead by a reasonably comfortable margin, and where I would consider an upset pretty surprising at this point. For what it's worth, Pennsylvania is probably the state I would consider the least confident of the Likely Biden states, and there is a good chance that it will be the tipping-point state when all the votes are counted. Finally, all remaining states I would categorize as safe for one candidate or the other, where the winner is likely to win by a large margin (likely double digits, and in many cases by 20% or more) and where I would have significant doubts about the validity of the election results if somehow an upset did occur. In conclusion, I hope this has given you all some welcome insights, and my final update will be up on Monday night, hopefully with less for you all to read. Be safe, wear a mask, and good luck getting through the final days of the campaign. Version: 16 Nine days until the election, and I have made some major changes for this map. Most notably from both an electoral vote perspective as well as a historical perspective is - unquestionably - the decision to switch Texas to Joe Biden. As I already explained on my last map, this is a state where I think Biden has an above average chance to beat his polls, given the rapid population growth there, and given what is without question going to be a record breaking voter turnout there: several large counties that have seen drastic Democratic gains in recent years either will or already have had their early vote this year exceed the *total* vote from 2016. Additionally, Biden has now moved into an exact tie in the polling average in Texas (as calculated by FiveThirtyEight), and we are close enough to election day that I feel the risk of a reversion to the historical mean is low enough that I am comfortable making the switch - though to be clear Texas still remains very much a Tossup. The second most important change is probably the shift of North Carolina from Tossup to Lean Biden, giving Biden a bit of insurance in case the polls end up being off in one or several other states. The other two significant changes for this map are the moves of Iowa to Biden and Ohio to Trump, though those states have looked like pure coin flips for a while now and I don't see much need to elaborate on either. I did contemplate moving Florida to Tossup, based on the shifts we have seen in the polling averages there, but upon further review of exactly why those averages have moved - a few clearly partisan Republican pollsters have been dumping outlier polls that are highly suspect, at least one of which (Trafalgar) appears to perhaps just be choosing a desired outcome in advance and then unscientifically adjusting their data to force such outcome - I ultimately decided against doing so. Finally, from an overall national perspective, it is clear that this election remains one in which Joe Biden has a substantial advantage both nationwide and in the tipping point states (probably in the neighborhood of a 9-10% lead nationally, and 6-7% in the states likely to decide the election), and time is rapidly running out for anything to change that. The debates are over, more people have voted early than ever before, and - as I have been hammering for months now - the Coronavirus pandemic remains the single most important news story in the country, especially now with new cases spiking to record daily totals yet again (over 80,000 new cases each of the last two days). While it is always possible that the polls could simply be wrong, the significantly lower number of undecided and third party voters this year relative to 2016 suggests that a large enough polling miss to actually result in an electoral upset is quite unlikely at this point. Version: 15 Just over two weeks out from the 2020 election, and I'm only making two small changes to confidence levels for this map. With time increasingly growing short for the electoral situation to change - I've already returned my mail ballot, along with millions of other Americans - I decided it was time to move Wisconsin to Likely Biden and South Carolina to Likely Trump. In spite of those changes, however, the state I have spent the most time thinking about during the last week has been Texas. As a state that has had a massive growth in both population and voter registration in the last few years, including something like 300K new registrations just in the last month or so, and with the state seeing what seems absolutely certain to be record voter turnout this year, I think the odds of Joe Biden beating his polls there are better than in probably any other swing state. I think there is a real chance the likely voter models that a lot of pollsters are using aren't going to be as reliable as they usually are, as they may be excluding newly-registered voters on the grounds that they have no voting history in the state. I am, however, not entirely certain about this, nor am I particularly confident about the scale of the effect if it does happen, so for now I've settled on a fairly cautious standard that I will only switch Texas to a Biden win if Trump's lead there drops below 1% in the polling averages. As of now, that hasn't happened (Trump has a lead of 1.4% in the current 538 average), and so I am still classifying Texas as a narrow Trump victory. Version: 14 This was one of the more difficult maps for me to settle on this cycle, as it is clear we are in a bit of a fluid situation nationally as the country continues to process the fallout from the White House coronavirus outbreak. A discrepancy has emerged between the national and state polls for the moment, with the national polls suggesting that Joe Biden leads by a margin of around 11-12%, while the state polls for now seem to line up with something closer to an 8-9% national lead. However, it is my understanding that there is some reason to believe that state polls may lag behind the national polls when there are large swings in the race. For the moment, I have decided to proceed with caution, and thus this map represents something closer to what the state polls are showing, around a 9% win nationally. Additionally, I have adjusted the third party vote share down to 2% nationally - with appropriate variation on a state-by-state level guided by historical precedent - resulting in somewhat fewer states where the winning candidate has under 50% of the vote. The most important changes, however, are in Nevada and Pennsylvania, as I am now classifying both as Likely Biden based upon recent polling - and on a re-evaluation of the tendency of Nevada polls to routinely underestimate the vote share for Democratic candidates. Additionally, though there is nowhere to indicate it on these maps, I would also apply a Likely Biden classification to the election as a whole at this point. I have been fairly cautious about making such a declaration before now, however I feel it is justified based not only on the polling margins, but also the fact that Biden is routinely reaching or exceeding 50% in polling from the likely tipping point states. This development means that a Trump comeback would require the current president to not only win over the vast majority of undecided voters - a group that is already much smaller than it was when he won late deciders in the 2016 cycle - but also make gains among voters who are already committed to vote for Joe Biden. While there is still some time left during which the state of the race could theoretically rebound in Donald Trump's favor, the polling data and the reality of current events suggest such a rebound is highly unlikely, and time is rapidly running out for any such rebound to occur. This is even more true than usual given the substantial increases we are seeing in early and mail-in voting this year due to the pandemic. Version: 13 Well - it has been an interesting two weeks. I was not planning on doing a major write-up with this scheduled prediction, but events have demanded otherwise. After a Supreme Court nomination, followed by a major news exposé on how little Donald Trump has paid in federal income taxes in recent years, and then a presidential debate that was nearly unwatchable as a result of the president's constant interruptions (which may prove to be the only presidential debate of the cycle), and honestly probably some other things that I have already forgotten in our ongoing national political maelstrom, we learned in the extremely early hours of Friday morning that Trump has contracted the very coronavirus that he has spent the entire year downplaying and lying about, and he has since been hospitalized. Not only that, but the virus has also spread among many of his top advisors as well as prominent Republican senators, likely as a result of a superspreader event at the White House held to celebrate the Supreme Court nominee announcement that occurred in *flagrant* violation of COVID social distancing and mask guidelines. While this series of events has caused elevated uncertainty in exactly how things may play out in the thirty days that remain before the election, we can say some things with a fair degree of confidence. Perhaps most importantly, Trump's illness has all but guaranteed that the coronavirus pandemic will remain the dominant news story for the rest of the election campaign, in spite of the Trump campaign's constant desperate attempts to change the subject to literally anything else all year. Additionally, at this moment at least, the early polling suggests that these events have caused a further - and perhaps sizeable - shift in the electorate toward former Vice President Joe Biden. As a result of these events and the recent polling, I am making multiple significant changes for this prediction. First, I have switched Georgia, Ohio, and the 2nd Congressional District of Maine - all of which already appeared extremely competitive - to narrow Biden wins. Second, I have shifted the confidence rating for Florida from Tossup back to Lean Biden - important for the electoral insurance it gives in the event of a large polling miss in one of the other critical swing states. Third, I am moving Michigan from Lean Biden to Likely Biden, becoming the first state won by Trump in 2016 to have that designation. I was even tempted to shift Texas to a Biden win, based on what we are seeing in the national polling, but I have decided to hold off on that for now until we see post-debate/post-COVID-diagnosis polling from that state. Finally, though this was already planned well in advance of any of these events, I should note that my predictions will now be moving to weekly updates for this final month of the election campaign: there will almost certainly be more polling at this stage of the cycle, and the polling changes are more likely to be relevant to the ultimate outcome than the temporary shifts that routinely occur throughout the summer and early fall, as time will begin to run out for any changes to shift back. Version: 12 I'm not thrilled about having to do an update so soon after the death of Justice Ruth Bader Ginsburg, as in the past my maps immediately following major news events have not had a particularly good track record, but I've committed myself to a schedule here and I'm not going to let that get derailed. While the race has continued to seem stable at the national level, I think there is some evidence that the race has moved ever so slightly toward Trump in the Southeast. As such, I have moved Florida back to Tossup for now and switched Georgia back to a narrow Trump victory. In addition, recent polls in states where we haven't had much polling all cycle have caused me to change the confidence levels in both Nevada and South Carolina from Solid to Lean Democratic and Republican respectively. All of that being said, Joe Biden remains in a clear and stable lead in all of the most likely tipping point states - with that lead perhaps even expanding slightly in Michigan and Wisconsin - and he remains a solid favorite (somewhere in the 80-85% range) to win the election overall in November. Version: 11 With the conventions out of the way and the race seeming to still be largely stable, I am making only one small - but important - change for this map: I have now moved Arizona into the Lean Democratic category. While Joe Biden has been leading there for a while, I had been reluctant to change its classification away from Tossup due to how reliably Republican that state has been in prior presidential elections. However, with less and less time left for the state of the race to change before election day, and especially considering how stable the race has been up to this point, I feel such a move is now justified. I also spent a fair amount of time debating if I wanted to shift Texas to Democratic for this map. I ultimately decided against doing so, but I am going to be keeping an exceptionally close eye on it going forward, as I think it is probably closer to a pure coin-flip race than many are realizing. Version: 10 Just making some very minor adjustments for this update - I wasn't inclined to make any major changes for this prediction given that we are in the middle of the conventions, and on top of that the race largely seems stable overall. I have finally moved Iowa to Tossup, though at this stage I would still say that it isn't quite a coin-flip race the same way Georgia and Ohio seem to be. With just over 70 days until the election, I'm going to start increasing the frequency of updates from this point forward, as hopefully we will start to get more frequent and higher-quality state polling fairly soon. Version: 9 With little more than 100 days before the 2020 election, the time has come for probably the single most important update to my electoral prediction this cycle. When I made my last prediction, it was clear that coronavirus cases were beginning to rise again - there were around thirty thousand new cases per day nationally at that point, up from a lengthy plateau of around twenty thousand cases per day previously - but it was unclear how severe the increase would be or how long it would last. Now, a month later, we are seeing sixty to seventy thousand new cases per day nationally and New York-scale outbreaks across multiple states, as well as increasing daily death tolls. For all of my previous maps, I had allowed for a significant possibility that future events outside the control of either candidate could intervene and change the fundamental dynamic of the presidential race - something I had failed to properly account for in 2016 and which caused me to underrate Trump's chances for much of that cycle. Thus, even though Joe Biden has been leading this race for over a year, I felt there was a reasonably large chance that could still change as we neared November: two months ago I probably would have given Biden roughly a 65-70% chance of winning the election - a real lead, but ultimately not *that* far off from a true coin-flip race. However, it is now abundantly clear that the single dominant news story all the way until the election is almost certainly going to be the continuing coronavirus pandemic, and the federal government's catastrophically botched response to it. As such, I am taking the step of moving all states that were won by Hillary Clinton in 2016 into the Safe Democratic category - or at least Likely Democratic if such a classification existed on this website. Additionally, I am moving both Wisconsin and Florida - states where Joe Biden has had consistent leads in the polls for a while but where Democrats had notably underperformed expectations in some recent cycles - from Tossup to Lean Democratic. This, importantly, puts Joe Biden well over 270 electoral votes in the categories of Lean and Safe, consistent with my view that he is now a clear favorite to win the 2020 election - with probably around an 80-85% chance of victory in the electoral college and well over 90% likelihood for winning the national popular vote. Barring any unforeseen changes in the national political landscape of such drastic scale that they somehow displace a once-in-a-century pandemic as the issue of greatest concern to the voting public, it is likely Biden's chances will increase further in the coming months - even if the overall victory map stays the same - as the clock would slowly run out of time for things to change. Version: 8 No changes in state leads on this map, but some significant changes to confidence levels. As the coronavirus pandemic continues and cases have begun to spike again in several states, it is clearly taking a further toll on president Trump's job approval rating. While it is hard to know exactly what will happen in future months, as so much is dependent on the course the pandemic takes, it is clear that there is at least a greater range of possible outcomes for the election in November than existed previously. This is in addition to a further deterioration in Trump's public support over his handling of recent protests against police violence and racism. As such, both Texas and Ohio have been moved - for now at least - to the Tossup category. Additionally, I have moved both Maine and Minnesota from Lean Democratic to Solid Democratic, as Donald Trump's approval numbers in both states have shifted somewhat significantly in the past few weeks. Finally, I have re-evaluated the likely third-party vote in a number of states, resulting in some minor shifts in percentages. Version: 7 Decided to go ahead with the plan to increase update frequency, as there has been significantly more state polling this month than there was in April. As the coronavirus pandemic continues, it appears to making a bit more of an impact than it did previously, with Donald Trump's disapproval on handling the pandemic approaching 60% and numerous polls showing Joe Biden's national and state leads expanding. While I think there could be some reversion toward the earlier numbers later in the year, the change seems significant enough that I am at least partially taking it into account. This results in the most important change on the map, with Pennsylvania now in the Lean Democratic category, thus bringing Joe Biden to just shy of 270 electoral votes with confidence better than Tossup. Additionally, I was very tempted to move Texas into the Tossup category due to several recent polls there showing a close race, but given that state's consistent Republican voting record over the last few decades, I ultimately decided against doing so at this time. I will be keeping a close eye on Texas polling however, and if I don't see any reversion toward its historical mean in the next two or three months I may eventually make that change. Finally, there is one development in Donald Trump's favor on this map, as I have reluctantly concluded that Iowa should for now be classified as a Lean Republican state, based upon recent polling. Version: 6 My first prediction since Joe Biden has become the presumptive Democratic nominee for 2020 comes with a small number of important changes. First, Florida has shifted from Republican to Democratic, though it remains a Tossup and probably the closest thing to a pure coin-flip on the map. Second, Virginia moves from Lean Democratic to Safe Democratic, though if a separate "Likely Democratic" category existed it would probably go there, as would Colorado and New Mexico. There are a few other percentage changes, but nothing I would think is really worth discussing here. Despite being in the middle of a pandemic that is probably the largest national crisis since World War Two, little has changed, as the overwhelming majority of voters in the country have had their minds made up about the Trump presidency since around spring 2018 at the latest. I've started looking a little bit more at state horserace polling than the previous maps, but there really isn't enough of it right now to reach even remotely confident conclusions, so this prediction is still largely based around the model I have built combining a national swingometer with state-by-state approval polling. Looking ahead, I was originally planning to start increasing the pace of updates to monthly starting with a prediction in May, but if state election polling remains as scarce as it currently is then it is more likely that the next update will instead be in late June. Version: 5 A bit of a boring map, but some important updates since last time. Michigan has looked like the most likely state to flip from 2016 for a while now, as Trump's approval ratings have continued to be quite weak there. As such, that state moves from Tossup to Lean Democratic. Additionally, Trump's approval ratings in Ohio have continued to hold up better than most similar states in the Midwest, and so I have moved it from Tossup to Lean Republican. As of right now I'm still using approval polling more than horse race polling to classify the states, but I may start to move toward the horse race polling in the next update. Version: 4 Last prediction of the year is a bit more unconventional, with Georgia going Democratic while North Carolina remains Republican. As with last time, this map is based largely on presidential approval-disapproval polling, but this time with a bit more mean-reversion toward the 2016 results. Version: 3 Spent some time earlier today going over what limited state-by-state presidential approval polling I could find and decided to use that to refine my prediction here. While obviously approval polling isn't going to match up exactly to voting outcomes, I think it should correlate reasonably well with the order in which states may flip. As such, I've switched Iowa to Democratic, and have also moved Texas from Tosssup - which was a characterization I was never entirely comfortable with on the last map - to Lean Republican. There are also a few other minor percentage changes that I've made, but honestly at this early stage it's probably not worth going into detail on any of those. Version: 2 First real prediction of the 2020 cycle, rather than the previous simulation. I see the Democrats as being favored to win the presidency next November, but with a fairly large range of possible outcomes, particularly given the uncertainty in the economy. I went back and forth on whether or not I should have Texas as a tossup, but I've seen enough suggesting that the state will at least be close that I ultimately decided it should be classified that way. Not really taking possible Democratic nominees into account for the predictions just yet, but honestly I'm not sure the nominee is going to make much of a difference given how strongly polarized opinions of the current president are. Version: 1 Am I doing this again? I guess I'm doing this again. Not so much a formal prediction to start off, just the outcome of a spreadsheet simulation I've set up based on a chosen hypothetical national popular vote outcome of D 53%, R 45%. Two uniform national swings producing the same final national 2020 margin are applied to each state relative to the 2016 and 2012 results, these are then averaged together at 80-20 weighting (which I think is more likely to be predictive than the 50-50 weighting that PVI uses), and finally the result in each state is adjusted by a randomly generated number. I'll do more thought-out predictions later once we have more information to go off of, but this feels like a good enough placeholder for now.
Version History Member Comments User's Predictions
Links
|
||||||||||||||||||||||||||||||||||||||||||||||||||||||||||||||||||||||||||||||||||||||||||||||||||||||||||||||||||||||||||||||||||||||||||||||||||||||||||||||||||||||||||||||||||||||||||||||||||||||||||||||||||||||||||||||||||||||||||||||||||||||||||||||||||||||||||||||||||||||||||||||||||||||||||||||||||||||||
 2024 President
 2022 Senate
 2022 Governor
 2020 President
 2018 Senate
 2018 Governor
 2016 President
 2014 Senate
 2014 Governor
 2012 President
 2012 Senate
 2012 Rep Primary
 2010 Senate
 2010 Governor
 2008 President
 2008 Dem Primary


Back to 2020 Presidential Prediction Home - Predictions Home