


|
Date of Prediction: 2020-11-02 Version:18
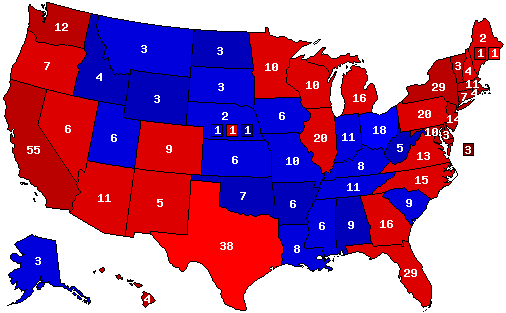
Prediction Map
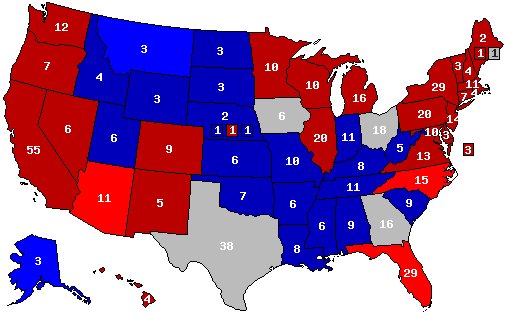
Confidence Map
Prediction States Won
Confidence States Won
State Pick-ups
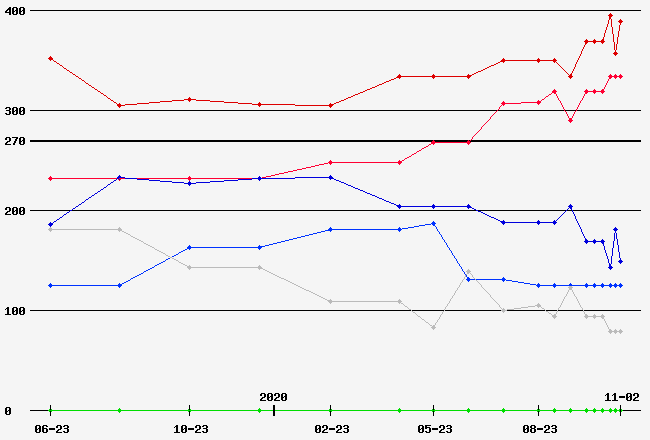
Prediction Score (max Score = 112)
Analysis
Well, this is it, my final presidential election forecast for 2020. There seems to be little change in the electoral situation relative to where things stood last week, and thus there are few changes for this map. While the national polls have narrowed *maybe* half a point or so in the last week, and even this small movement looks like it is simply due to pollster herding, the state polls - which have a history of being more accurate - are showing no similar movement. Joe Biden's lead in this race appears to be around 9% nationally, and some analysis I did earlier tonight actually makes me more confident in a final margin at least fairly close to that number than I was previously. I took the time to look back at the state polling in 2016, and what each state's polls implied about the final national margin that year: Trump's polling leads at the end of the 2016 campaign in Iowa and Ohio were both large enough as to suggest he would actually win the national popular vote - by about 5% and 1% respectively - if the national swing had been uniform, and a number of other states like New Hampshire also suggested a much closer race than what the final national polls suggested. These polls should have been a warning sign that politically similar states like Michigan, Wisconsin, Pennsylvania, and Maine could be closer than the polls there were suggesting, and indeed that is exactly what ended up happening. After reviewing similar data for this year in states with a large number of polls, I see no similar warning signs this year. The worst implied result for Biden is if the national vote is similar to what the polls in Florida indicate, which would still be around a 6% margin nationally - such a result would still be large enough that an inversion between the winner of national vote and the electoral college would be quite unlikely. On the other side of things, some states actually suggest a larger national win for Biden than the 9% that is showing up in the average: Biden's polling lead in New Hampshire, for instance, would imply something like a 12.5% lead nationally, which would essentially guarantee a Biden landslide in the electoral college, and other states like Michigan, Wisconsin, and Texas also suggest a double-digit national win for Biden. I do not mean to suggest by any of this that it is impossible for Trump to win the election - obviously it is essential that voters who have not yet cast their ballots actually turn out to vote tomorrow, and that they don't stay home out of a sense of complacency - but if Trump were somehow to win it would be genuinely an out-of-nowhere shock without any evidence in advance, rather than a case like 2016 where the warning signs were present but went ignored by most analysts. Now, with all of that out of the way, I will address the two changes I have made for this final map, as well as a few other states that did not change, but which remain important. First, I have switched Iowa from a narrow Biden win to a narrow Trump win. The polls had already been close there, and Iowa was a state I was never super comfortable having in the Biden column due to what I know of the trends in how votes have shifted in the years since the 2016 election - Democrats have generally been making their largest gains in the suburbs of large metro areas, while Iowa is a very rural state. As such, when the Des Moines Register poll came out a few days ago with Trump ahead substantially there, it was a very easy call for me to switch the state back to a Trump lead - though I do think it will be a closer final margin than the margin in that singular poll, hence the continued Tossup status. Finally, I have made the - perhaps ill-advised - decision to switch Texas back to a Biden victory. As I have said before, this is a state where I think Biden has a pretty good chance to beat his polls, given that the absolutely enormous early vote there has already guaranteed a record-breaking final vote turnout - notably we are seeing especially large turnout increases in the aforementioned suburbs where we know Democrats have improved their standing most relative to 2016 - and thus there is a higher than usual chance that the likely voter screens that most polls use will end up being too restrictive, missing many voters. Trump currently retains a very narrow lead in the polling there - exactly 1% in the FiveThirtyEight average at this moment - but that is close enough for me to go out on a limb and put Biden narrowly ahead in my prediction. This was not an easy decision, given the enormous implications it has for the electoral college totals, and I do think Texas is not much beyond a pure 50-50 coin flip, but this is my most intellectually honest view of the situation. As for other states: I did contemplate moving both Florida and North Carolina to Tossup status, but enough polling has come out in the last few days that I have to conclude that both states still fit my Lean classification description, in that the balance of the evidence suggests that one candidate (Biden) is ahead by a consistent but modest margin. Trump could still end up winning both states in a situation where he beats his polls, but they are far enough from being pure coin-flips that I can't say that a Tossup status is justified - even in spite of my natural inclination to be even more skeptical of Florida than most states. Finally, I have spent a lot of time thinking about Pennsylvania as well, but ultimately all of the credible polling here remains consistent with a decent Biden win - probably somewhere in the neighborhood of 5-6% at the end. Additionally, after reviewing mail ballot return rates for Pennsylvania, which has been a source of great concern in the press, I think it is reasonable to say that if somehow there were a court decision against counting mail ballots that arrive after election day, only about 0.5% of Biden's state margin could realistically be at risk, which is less than what some of the current fears circulating would suggest, and thus I remain comfortable with a final rating for Pennsylvania of Likely Biden. This leaves a national situation with an unusually large range of likely final outcomes, ranging from somewhere between a narrow Biden win with 279 electoral votes (If Trump beats his polls by realistic margins: Repeating what I said earlier, an usually large polling miss where Trump somehow wins Pennsylvania is not impossible, just unlikely) to a landslide Biden win with 413 electoral votes (And maybe more if Biden beats his polls by an unusually large margin). I hope those who have viewed these predictions feel more informed by having looked at them, and I conclude this year as I conclude every single presidential election prediction here, though with some added urgency given the national crisis we are in. If you are an American, and you think it matters how this country is governed, and if you haven't already done so, please: VOTE
Prediction History
Comments History
- show
Version History Member Comments User's Predictions
Links
|
||||||||||||||||||||||||||||||||||||||||||||||||||||||||||||||||||||||||||||||||||||||||||||||||||||||||||||||||||||||||||||||||||||||||||||||||||||||||||||||||||||||||||||||||||||||||||||||||||||||||||||||||||||||||||||||||||||||||||||||||||||||||||||||||||||||||||||||||||||||||||||||||||||||||||||||||||||||||
 2024 President
 2022 Senate
 2022 Governor
 2020 President
 2018 Senate
 2018 Governor
 2016 President
 2014 Senate
 2014 Governor
 2012 President
 2012 Senate
 2012 Rep Primary
 2010 Senate
 2010 Governor
 2008 President
 2008 Dem Primary


Back to 2020 Presidential Prediction Home - Predictions Home