


|
Date of Prediction: 2020-10-23 Version:1
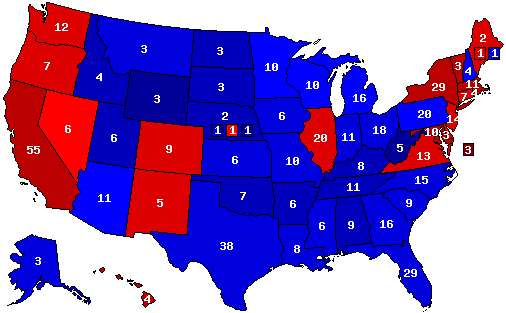
Prediction Map
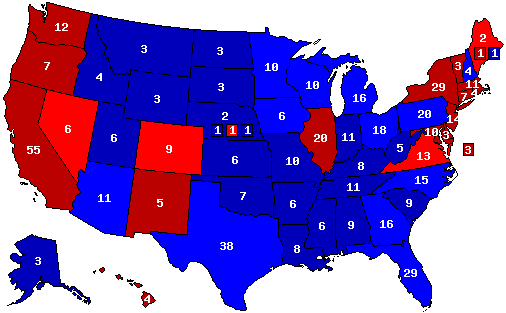
Confidence Map
Prediction States Won
Confidence States Won
State Pick-ups
Prediction Score (max Score = 112)
Analysis
No tossups used. Trump makes moderate gains in the Rust Belt, and he improves his margins with non-college whites and minorities. Biden's principal gains are among college whites and in the Sun Belt sans Florida and maybe North Carolina. Minnesota flips to Trump due to further Democratic erosion in the Iron Range and rural parts of the state; parts of the Twin Cities metro may trend further left but are offset by Republican gains elsewhere. New Hampshire flips to Trump because Biden's positions on trade are a poor fit for the historically protectionist state and Biden's spending lead there is relatively small compared to other states. On the other hand, Nebraska's 2nd congressional district flips to Biden as party registration trends there are favorable to the Democrats which signals a shift to the left. Across the board the third party vote share is lower, so in many states Trump and Biden both get a higher percentage of the vote than Trump and Clinton did in 2016. Member Comments User's Predictions
Links
|
|||||||||||||||||||||||||||||||||||||||||||||||||||||||||||||||||||||||||||||||||||||||||||||||||||||||||||||||||||||||||||||||||||||||||||||||||||||||||||||||||||||||||||||||||||||||||||||||||||||||||||||||||||||||||||||||||||||||||||||||||||||||||||||||||
 2024 President
 2023 Governor
 2022 Senate
 2022 Governor
 2021 Governor
 2020 President
 2020 Senate
 2020 Governor
 2019 Governor
 2018 Senate
 2018 Governor


Back to 2020 Presidential Prediction Home - Predictions Home