


|
Date of Prediction: 2020-11-02 Version:111
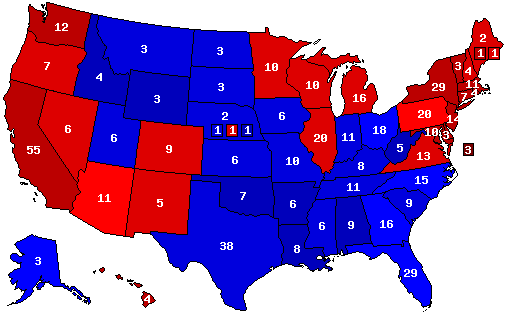
Prediction Map
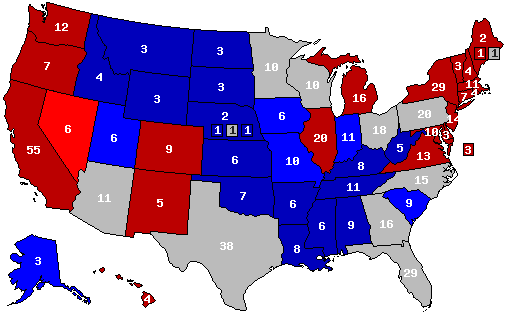
Confidence Map
Prediction States Won
Confidence States Won
State Pick-ups
Prediction Score (max Score = 112)
Analysis
FINAL PREDICTION:<br /> <br /> Biden has edge to win but Trump has clear path to 270.<br /> <br /> Biden has more obvious paths to 270, and Trump needs to essentially draw the inside straight to pull out a win.<br /> <br /> These states are the closest to being pure toss-ups and might decide the whole thing: Florida, Georgia, North Carolina and Ohio. Trump has to win all of them to have a shot at re-election. I think Trump will pull out the win in all of them, though his margin of victory will be slim in Georgia, Florida and North Carolina.<br /> <br /> Biden starts out being favored in every state Clinton carried in 2016. The only possible loose bricks as Biden attempts to rebuild the blue wall are Minnesota and possibly Nevada. Nevada looks to have been shored up the Democrats at the last minute. Minnesota has remained surprisingly competitive. The key will be what the Democrat's edge is in the Twin Cities and surrounding suburbs, but if Trump flips Minnesota he's likely won Michigan and/or Wisconsin and thus the election.<br /> <br /> Biden has the edge to flip Arizona, although it has been tightening. Democrats will see that as their silver lining in the Sun Belt. I don't think Biden has a realistic shot at Texas, though it is closer.<br /> <br /> This race will come down to the Rust Belt states of Pennsylvania, Michigan and Wisconsin. Of those, I think Biden has more or less locked up Michigan and Wisconsin. Pennsylvania he needs to worry about as Trump could be surging late there. Pennsylvania is the tipping point state for Trump: if he does win it, he's likely re-elected, and if he loses it, he's probably headed for defeat.<br /> <br /> All of which is why I like Biden's chances better than Trump's But Trump is not out of this race by any means.
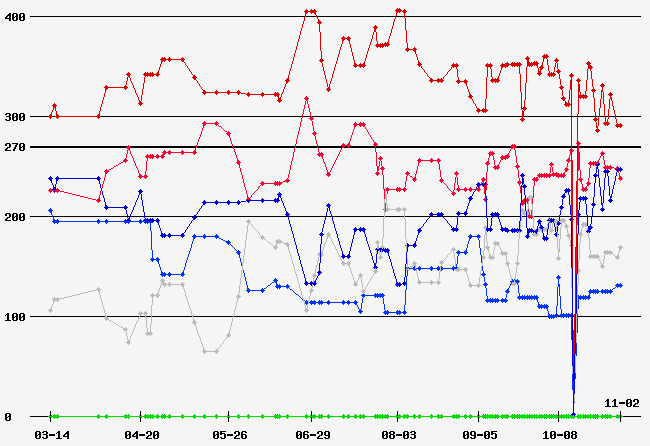
Prediction History
Comments History
- show
Version History Member Comments User's Predictions
Links
|
||||||||||||||||||||||||||||||||||||||||||||||||||||||||||||||||||||||||||||||||||||||||||||||||||||||||||||||||||||||||||||||||||||||||||||||||||||||||||||||||||||||||||||||||||||||||||||||||||||||||||||||||||||||||||||||||||||||||||||||||||||||||||||||||||||||||||||||||||||||||||||||||||||||||||||||||||||||||||||||||||||||||||||||||||||||||||||||||||||||||||||||||||||||||||||||||||||||||||||||||||||||||||||||||||||||||||||||||||||||||||||||||||||||||||||||||||
 2024 President
 2023 Governor
 2022 Senate
 2022 Governor
 2020 President
 2020 Senate
 2020 Governor
 2019 Governor
 2018 Senate
 2018 Governor
 2016 President
 2016 Senate
 2016 Governor
 2014 Senate
 2014 Governor
 2012 President
 2012 Senate
 2012 Governor
 2012 Rep Primary
 2011 Governor
 2010 Senate
 2010 Governor
 2009 Governor
 2008 President
 2008 Senate
 2008 Governor
 2007 Governor
 2006 U.S. Senate
 2006 Governor
 2004 President


Back to 2020 Presidential Prediction Home - Predictions Home