


|
Date of Prediction: 2006-11-06 Version:20
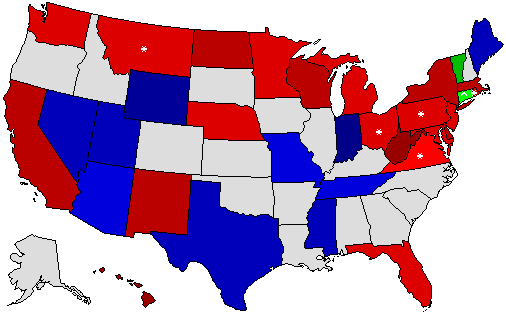
Prediction Map
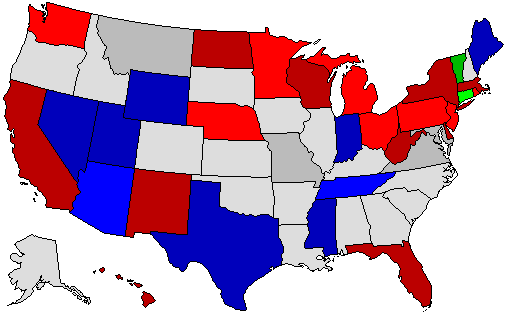
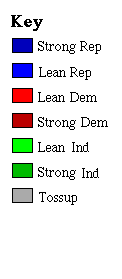
* = Pickup via defeat of incumbent; ^ = Pickup of an open seat Confidence Map
Prediction States Won
Confidence States Won
State Pick-ups
Predicted Senate Control (110th Congress):
Prediction Score (max Score = 66)
Comments
Final prediction: 50 Reps, 48 Dems, 2 Ind. Reps keep control of the Senate with Cheney the tiebreaker.
Prediction History
Comments History
- hide
Version: 16 The races to watch the next 12 days: Version: 15 Giving MO to Talent right now, since he has the edge in cash reserves. Subject to change. Version: 13 TN back to lean Rep, based on new SurveyUSA poll. Version: 12 Changed TN to slight lean Dem, based on recent polls: TN, MO and NJ the races to watch election night. Version: 11 Moved TN to tossup, otherwise no significant change. Version: 5 MT to Lean Dem, OH to Lean GOP. Version: 2 Two changes based on recent polls: OH - DeWine appears to be solidifying a lead recently, so Rep for now; NJ - The incumbant holds a four-point lead in latest Rasmussen poll, so Dem for now (though I think this may be the most competitive senate race this fall). Version: 1 Easiest pickup for Dems: PA. Santorum is too out of the mainstream. Dems also stand a good chance in MT with the unpopular Burns fading. MO too. Best hope for Reps is in NJ, and I rate that as a Rep pickup with the Kean name going a long way there - Jerseyites haven't warmed to their new senator. Pickup of 3 seats for Dems at this time.
Version History Member Comments User's Predictions
Links
|
|||||||||||||||||||||||||||||||||||||||||||||||||||||||||||||||||||||||||||||||||||||||||||||||||||||||||||||||||||||||||||||||||||||||||||||||||||||||||||||||||||||||||||||||||||||||||||||||||||||||||||||||||||||||||||||||||||||||||||||||||||||||||||||||||||||||||||||||||||||||||||||||||||||||||||||||||||||||||||||||||||||||||||||||||||||||||||||||||||||||||||||||||||||||||||||||||||||||||||||||||||||||||||||||||||||||||||||||||||||||||||||||||||||||||||
 2023 Governor
 2022 Senate
 2022 Governor
 2020 President
 2020 Senate
 2020 Governor
 2019 Governor
 2018 Senate
 2018 Governor
 2016 President
 2016 Senate
 2016 Governor
 2015 Governor
 2014 Senate
 2014 Governor
 2013 Governor
 2012 President
 2012 Senate
 2012 Governor
 2010 Senate
 2010 Governor
 2008 President
 2008 Senate
 2008 Governor
 2006 U.S. Senate
 2006 Governor
 2004 President
Back to 2006 Senatorial Prediction Home - Predictions Home