


|
Date of Prediction: 2006-11-07 Version:13
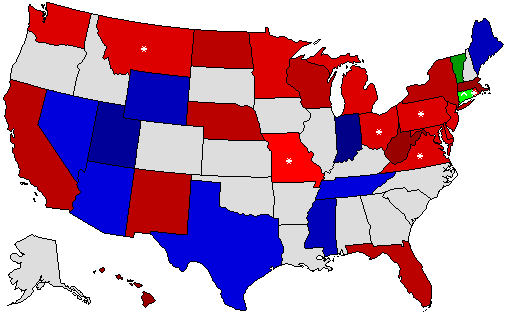
Prediction Map
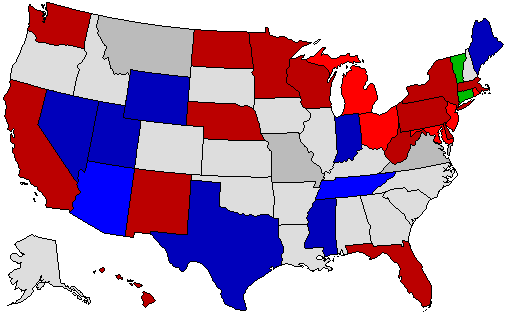
* = Pickup via defeat of incumbent; ^ = Pickup of an open seat Confidence Map
Prediction States Won
Confidence States Won
State Pick-ups
Predicted Senate Control (110th Congress):
Prediction Score (max Score = 66)
Comments
Have to go by the individual races...and I think the Democrats actually take it. But it's close...
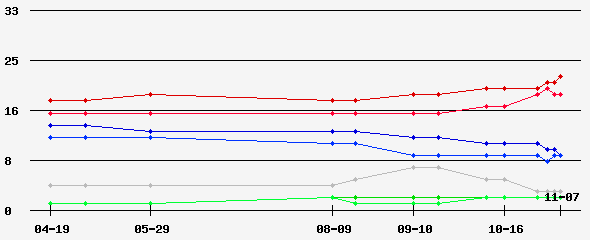
Prediction History
Comments History
- hide
Version: 12 Moved Tennessee to lean, but I'm keeping Maryland as lean too. Beyond that, it seems to be down to Virginia, Missouri and Montana now. They're all very, very hard to call. Right now I say Montana sticks with Burns thanks to his momentum and the others swing Democrat, but I really have no idea. Version: 11 Ohio is on the cusp of solid (as is Arizona). Missouri, Virginia and Tennessee are the only tossups now. Version: 10 Reduced the number of tossups and leans in favour of solids as we're approaching election day. Michigan is close to solid, Virginia is close to tossup. Version: 9 Just flipped Wyoming down to 60% in light of the recent MD-poll. :P Very minor change... Version: 8 Changing CT to lean (it looks like a bare lean), Montana to lean (it is an almost equally bare lean) and Rhode Island to Democrat (all these polls can't be ignored). Version: 7 Flipped some of the percentages around. Version: 6 Finally changed Ohio to tossup-Dem. The polls became too over-bearing for me. I also flipped Tennessee to tossup, it fits better in that category than lean now, although it is really in between. Version: 5 Conneticut is of course something of a tossup even though Lieberman definitely retains the edge. Version: 4 Lieberman looks more likely than not to lose the primary, but he still takes it as an independent. Version: 3 Finally flipped Montana to Democrats now, the latest Mason-Dixon poll refutes my suspicion of Burns catching up. The latest approval rating for Burns was also pretty bad. Finally, looking at sub-groups it seemed to me like those with highest approval of him were those least likely to vote or follow the news (youths, blacks, etc) which means that he could slide further by election day. Version: 2 Changed some shadings, that's all. If a few more polls come in as confirmation, I might switch New Jersey to GOP and Montana to Democrat. But not yet. Version: 1 This is how I predict it right now. Pennsylvania is still not in the bag, but it's lean Democrat. MO, MN, NJ and MT could go either way. RI, MI, OH are long-shots that are not totally out of the question yet.
Version History Member Comments User's Predictions
Links
|
||||||||||||||||||||||||||||||||||||||||||||||||||||||||||||||||||||||||||||||||||||||||||||||||||||||||||||||||||||||||||||||||||||||||||||||||||||||||||||||||||||||||||||||||||||||||||||||||||||||||||||||||||||||||||||||||||||||||||||||||||||||||||||||||||||||||||||||||||||||||||||||||||||||||||||||||||||||||||||||||||||||||||||||||||||||||||||||||||||||||||||||||||||||||||||||||||||||||||||||||||||||||||||||||||||||||||||||||||||||||||||||||||||||||||||||||||||||||||||||||||||||||||||
 2020 President
 2020 Senate
 2020 Governor
 2019 Governor
 2018 Senate
 2018 Governor
 2017 Governor
 2016 President
 2016 Senate
 2016 Governor
 2014 Senate
 2014 Governor
 2013 Governor
 2012 President
 2012 Senate
 2012 Governor
 2012 Rep Primary
 2011 Governor
 2010 Senate
 2010 Governor
 2009 Governor
 2008 President
 2008 Senate
 2008 Governor
 2008 Dem Primary
 2008 Rep Primary
 2007 Governor
 2006 U.S. Senate
 2006 Governor
 2004 President
Back to 2006 Senatorial Prediction Home - Predictions Home