


Note: The Google advertisement links below may advocate political positions that this site does not endorse.
|
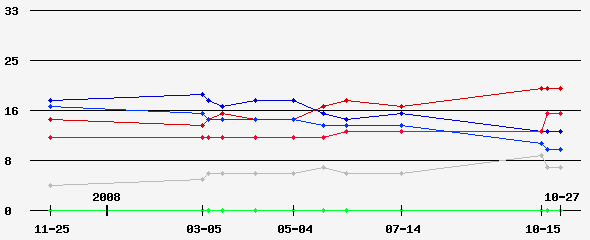
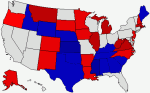
Date of Prediction: 2008-10-15 Version:10
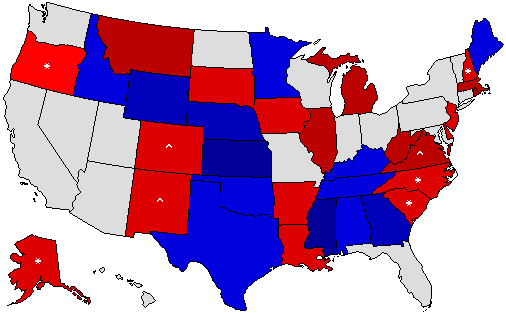
Prediction Map
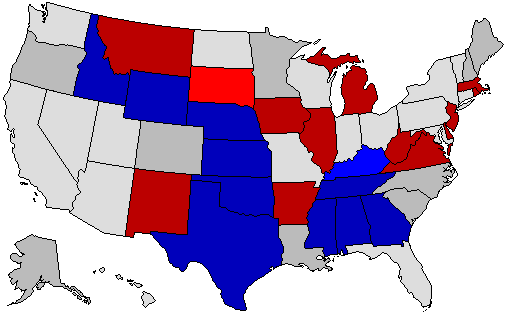
* = Pickup via defeat of incumbent; ^ = Pickup of an open seat Confidence Map
Prediction States Won
Confidence States Won
State Pick-ups
Predicted Senate Control (111th Congress):
Analysis
Bob Conley for Senate.
Prediction History
Comments History
- hide
Version: 11 Any comments? Version: 10 Bob Conley for Senate. Version: 9 Ventura Version: 8 the NJGOP made the wrong choice. Version: 7 How do you enter your prediction for the second MS seat? Version: 4 A potential Ventura run in my mind will improve Franken's chances. Version: 2 Sabrin pulls an upset victory over Lautenburg. Go ahead and bash me for my optimism.
Version History User's Predictions
Links
|
|||||||||||||||||||||||||||||||||||||||||||||||||||||||||||||||||||||||||||||||||||||||||||||||||||||||||||||||||||||||||||||||||||||||||||||||||||||||||||||||||||||||||||||||||||||||||||||||||||||||||||||||||||||||||||||||||||||||||||||||||||||||||||||||||||||||||||||||||||||||||||||||||||||||||||||||||||||||||||||||||||||||||||||||||||||||||||||||||||||||||||||||||||||
 2022 Senate
 2022 Governor
 2020 President
 2020 Senate
 2016 President
 2016 Senate
 2016 Governor
 2015 Governor
 2014 Senate
 2014 Governor
 2010 Senate
 2010 Governor
 2009 Governor
 2008 President
 2008 Senate
 2008 Governor
 2008 Dem Primary
 2007 Governor
 2006 U.S. Senate
 2006 Governor
Back to 2008 Senatorial Prediction Home - Predictions Home
© Dave Leip's Atlas of U.S. Elections, LLC 2019 All Rights Reserved