


|
Date of Prediction: 2008-11-03 Version:95
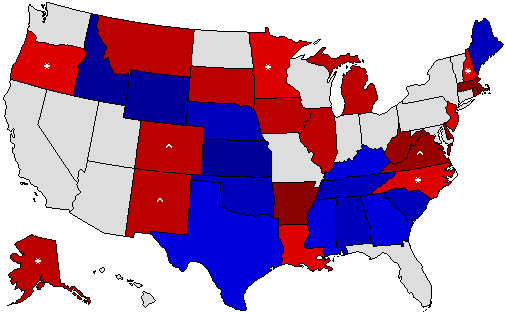
Prediction Map
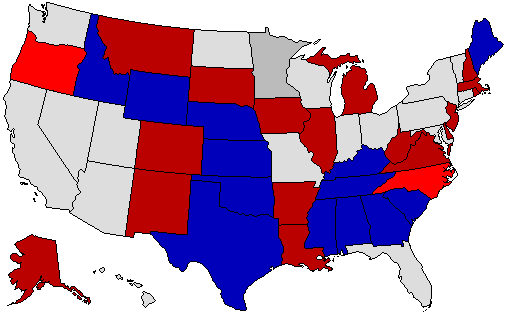
* = Pickup via defeat of incumbent; ^ = Pickup of an open seat Confidence Map
Prediction States Won
Confidence States Won
State Pick-ups
Predicted Senate Control (111th Congress):
Prediction Score (max Score = 66)
Analysis
No Analysis Entered
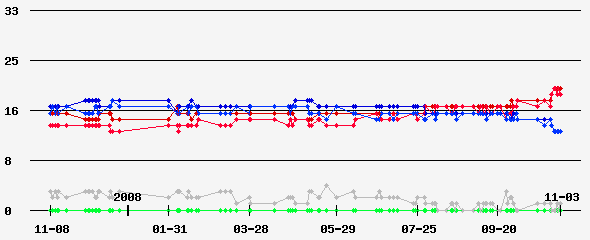
Prediction History
Comments History
- hide
Version: 93 59D-41R Version: 92 Last prediction. Version: 90 57D-43R Version: 87 Final Prediction Version: 86 D favored: LA,NH,NM,CO,AK Version: 77 top tier: CO,NM,NH,VA Version: 75 Top tier: AK,CO,NH,NM,VA Version: 74 Top tier: CO,VA,NH,NM Version: 72 Tier 1: AK,CO,NM,NH,VA Version: 69 Net: VA,NM,NH,CO Version: 68 Net gain 4-5 seats, will come down to MN or AK Version: 67 Ultra safe SC,AL,MS,VA,NM,ME Version: 62 Order of vul: VA,NM,NH,CO,AK,OR Version: 38 Dems net gain 3-4 senate seats, either NH or CO can go the GOP's way. Version: 36 Tossups: CO and AK Version: 31 55-45 senate, Landrieu and Coleman should win their races. The only race I see that is truely a tossup is CO and the presidential race should be a factor. Version: 29 TUPS: CO, LA, and MN Version: 27 55-45 senate, net gain 4 seats, with the possibility of winning OR, AK, or MN. Version: 26 55-45 Senate. Version: 17 With a net gain of 3-5 seats, the only one in trouble for the Dems is Mary Landrieu and despite the polls CO, NM, and NH go to the Dems. Version: 13 3 tossups AK, MN, and CO Version: 9 The republicans are likely to lose seats, I expect them to pickup at least one, which is Mary Landrieu. Version: 4 MN and OR leans republican, possible for an upset, but lean to the incumbant party.
Version History Member Comments User's Predictions
Links
|
||||||||||||||||||||||||||||||||||||||||||||||||||||||||||||||||||||||||||||||||||||||||||||||||||||||||||||||||||||||||||||||||||||||||||||||||||||||||||||||||||||||||||||||||||||||||||||||||||||||||||||||||||||||||||||||||||||||||||||||||||||||||||||||||||||||||||||||||||||||||||||||||||||||||||||||||||||||||||||||||||||||||||||||||||||||||||||||||||||||||||||||||||||||||||||||||||||||||||||||||||||||||||||||||||||||||||||||||||||||||||||||||||||||||||||||||||||||||||||||||||||||||||||||||||||||||||||||||||||||||||||||||||||||||||||||||||||||||||||||
 2024 President
 2023 Governor
 2022 Senate
 2022 Governor
 2021 Governor
 2020 President
 2020 Senate
 2020 Governor
 2019 Governor
 2018 Senate
 2018 Governor
 2017 Governor
 2016 President
 2016 Senate
 2016 Governor
 2015 Governor
 2014 Senate
 2014 Governor
 2013 Governor
 2012 President
 2012 Senate
 2012 Governor
 2012 Rep Primary
 2011 Governor
 2010 Senate
 2010 Governor
 2009 Governor
 2008 President
 2008 Senate
 2008 Governor
 2008 Dem Primary
 2008 Rep Primary
 2007 Governor
 2006 U.S. Senate
 2006 Governor
 2004 President
Back to 2008 Senatorial Prediction Home - Predictions Home