


Note: The Google advertisement links below may advocate political positions that this site does not endorse.
|
Date of Prediction: 2012-11-05 Version:7
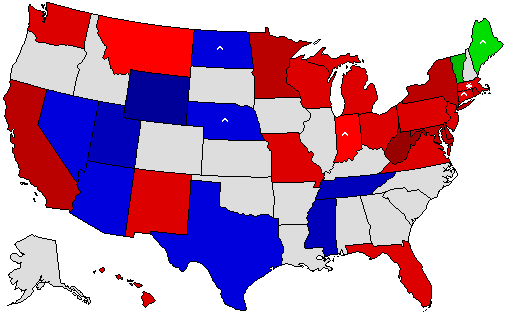
Prediction Map
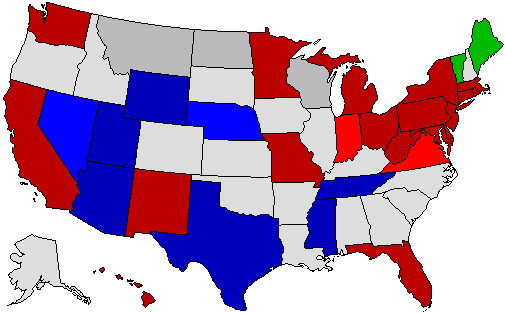
* = Pickup via defeat of incumbent; ^ = Pickup of an open seat Confidence Map
Prediction States Won
Confidence States Won
State Pick-ups
Predicted Senate Control (113th Congress):
Analysis
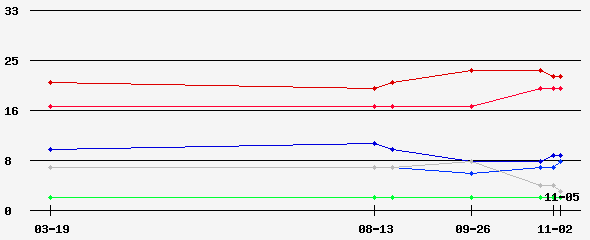
Not much changed from the last map. I see almost no way that the Republicans could gain enough seats to regain the Senate: perhaps if the polls are misreading the races in Indiana and Missouri, where individuals may feel ashamed to admit a vote for Akin or Mourdock, there could be enough upsets for the Republicans to win, but I don't expect this to happen.
Prediction History
Comments History
- show
Version History Member Comments User's Predictions
Links
|
|||||||||||||||||||||||||||||||||||||||||||||||||||||||||||||||||||||||||||||||||||||||||||||||||||||||||||||||||||||||||||||||||||||||||||||||||||||||||||||||||||||||||||||||||||||||||||||||||||||||||||||||||||||||||||||||||||||||||||||||||||||||||||||||||||||||||||||||||||||||||||||||||||||||||||||||||||||||||||||||||||||||||||||||
 2024 President
 2022 Senate
 2022 Governor
 2020 President
 2018 Senate
 2018 Governor
 2016 President
 2014 Senate
 2014 Governor
 2012 President
 2012 Senate
 2012 Rep Primary
 2010 Senate
 2010 Governor
 2008 President
 2008 Dem Primary


Back to 2012 Senatorial Prediction Home - Predictions Home
© Dave Leip's Atlas of U.S. Elections, LLC 2019 All Rights Reserved