PredictionsEndorse2012 Senatorial Predictions - Orser67 (D-PA) ResultsPolls
Note: The Google advertisement links below may advocate political positions that this site does not endorse.
Date of Prediction: 2012-09-25 Version:1
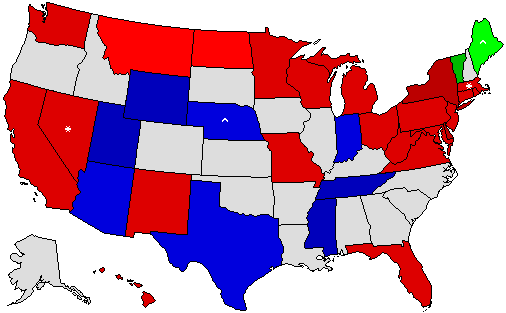
Prediction Map
Orser67 MapPrediction Key

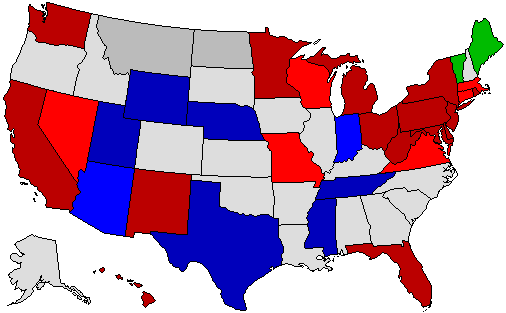
* = Pickup via defeat of incumbent; ^ = Pickup of an open seat

Confidence Map
Orser67 MapConfidence Key

Prediction States Won
17 |
33 |
50 |
Dem23
 
pie
Rep8
 
Ind2
 
Non17
 

Confidence States Won
17 |
33 |
50 |
Dem21
 
pie
Rep8
 
Ind2
 
Tos2
 
Non17
 

State Pick-ups

Gain Loss Hold Net Gain
Inc. Open Total Inc. Open Total Inc. Open Total
Dem+20+20-1-115520+1
Rep0+1+1-2-1-3437-2
Ind0+1+1000101+1


Predicted Senate Control (113th Congress):
Party Seats Up Seats Not Up Total Seats
Democratic233053
Republican83745
Independent202
pie

Analysis

I didn't put too much thought into the percentages for non-competitive states.

Ultimately I think that it will be a Democratic mini-wave, although not quite a large enough wave to net victories in Arizona or Indiana. Missouri might be in that category as well if not for Akin's comments.

Massachusetts is just too Democratic to re-elect Brown except in a good Republican year. Same with Connecticut, to a lesser extent. Democrats have better candidates in Virginia, North Dakota, and Montana (as well as Ohio and Florida).

The Obama/Reid turnout operation carries the Democrats to a win in Nevada. A good Democratic year boosts Baldwin to victory.

Nebraska, Hawaii, and to a lesser extent New Mexico never really stood a chance at being competitive so long as the party with the upper hand ran a decent campaign.

King caucuses with the Democrats, giving them 55 senators...just enough to survive until 2016 with a majority (unless it's a wave election).


Member Comments

User's Predictions

Prediction Score States Percent Total Accuracy Ver #D Rank#Pred
P 2020 President 53/56 42/56 95/112 84.8% pie 4 131 179T684
P 2020 Senate 30/35 24/35 54/70 77.1% pie 2 159 101T423
P 2016 President 48/56 23/56 71/112 63.4% pie 3 222 552T678
P 2016 Senate 30/34 16/34 46/68 67.6% pie 2 222 252T362
P 2016 Governor 9/12 7/12 16/24 66.7% pie 2 375 25T279
P 2014 Senate 30/36 16/36 46/72 63.9% pie 5 243 273T382
P 2014 Governor 26/36 13/36 39/72 54.2% pie 4 214 253T300
P 2013 Governor 2/2 1/2 3/4 75.0% pie 1 158 17T153
P 2012 President 55/56 44/56 99/112 88.4% pie 1 54 146T760
P 2012 Senate 31/33 18/33 49/66 74.2% pie 1 42 128T343
P 2010 Senate 26/37 15/37 41/74 55.4% pie 2 201 375T456
P 2010 Governor 28/37 14/37 42/74 56.8% pie 1 353 230T312
P 2009 Governor 1/2 0/2 1/4 25.0% pie 1 100 92T103
P 2008 President 54/56 40/56 94/112 83.9% pie 13 152 115T1,505
P 2008 Senate 32/33 16/33 48/66 72.7% pie 4 152 172T407
P 2008 Governor 11/11 7/11 18/22 81.8% pie 1 228 50T264
P 2008 Dem Primary 7/52 7/52 14/104 13.5% pie 1 - 216T271
P 2007 Governor 3/3 2/3 5/6 83.3% pie 2 97 58T167
Aggregate Predictions 476/587 305/587 781/1174 66.5% pie


Back to 2012 Senatorial Prediction Home - Predictions Home


Terms of Use - DCMA Policy - Privacy Policy and Cookies

© Dave Leip's Atlas of U.S. Elections, LLC 2019 All Rights Reserved