


Note: The Google advertisement links below may advocate political positions that this site does not endorse.
|
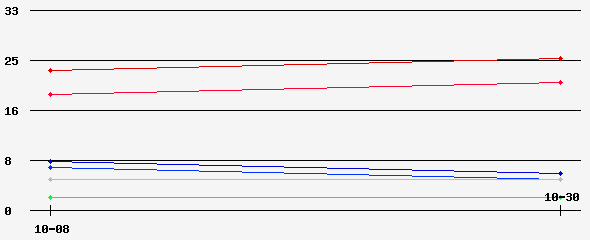
Date of Prediction: 2012-10-30 Version:2
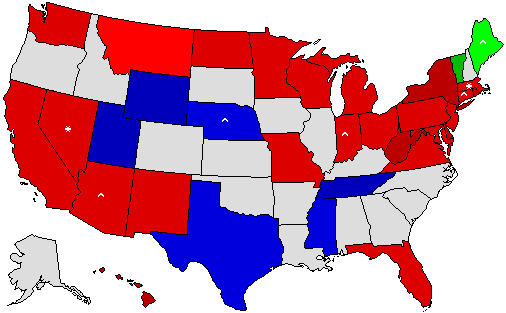
Prediction Map
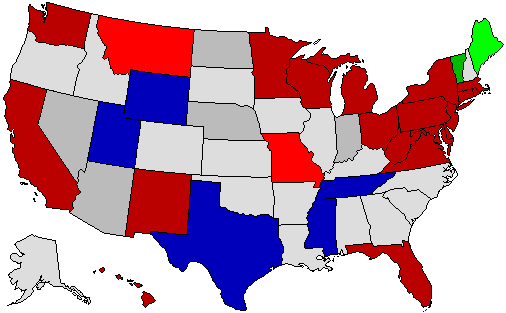
* = Pickup via defeat of incumbent; ^ = Pickup of an open seat Confidence Map
Prediction States Won
Confidence States Won
State Pick-ups
Predicted Senate Control (113th Congress):
Analysis
The Democrats are in a strong position defending a large number of seats in territory that is inconsistently receptive to the party. Indeed, rather than losing seats they seem on track to make gains. Nebraska and North Dakota, written off without incumbents to defend them, are proving fickle ground for the GOP this year, while demographic shifts give Democrats an emerging advantage in Nevada and Arizona. Finally, morally reprehensible comments about rape expressed by candidates in Missouri and Indiana leave independents flocking to otherwise unpopular Democrats.
Prediction History
Comments History
- show
Version History Member Comments User's Predictions
Links
|
|||||||||||||||||||||||||||||||||||||||||||||||||||||||||||||||||||||||||||||||||||||||||||||||||||||||||||||||||||||||||||||||||||||||||||||||||||||||||||||||||||||||||||||||||||||||||||||||||||||||||||||||||||||||||||||||||||||||||||||||||||||||||||||||||||||||||||||||||||||||||||||||||||||||||||||||||||||||||||||||||||||||||||||||||||||||||||||||||||||||||||||||||||||||||||
 2022 Senate
 2020 President
 2020 Senate
 2020 Governor
 2018 Senate
 2018 Governor
 2016 President
 2016 Senate
 2016 Governor
 2014 Senate
 2014 Governor
 2013 Governor
 2012 President
 2012 Senate
 2012 Governor
 2010 Senate
 2010 Governor
 2008 President
 2006 U.S. Senate
 2006 Governor


Back to 2012 Senatorial Prediction Home - Predictions Home
© Dave Leip's Atlas of U.S. Elections, LLC 2019 All Rights Reserved