


Note: The Google advertisement links below may advocate political positions that this site does not endorse.
|
Date of Prediction: 2014-11-03 Version:11
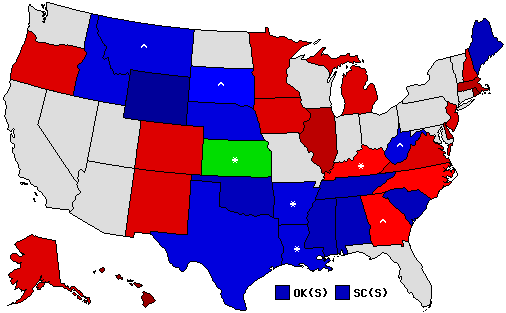
Prediction Map
* = Pickup via defeat of incumbent; ^ = Pickup of an open seat Confidence Map
Prediction States Won
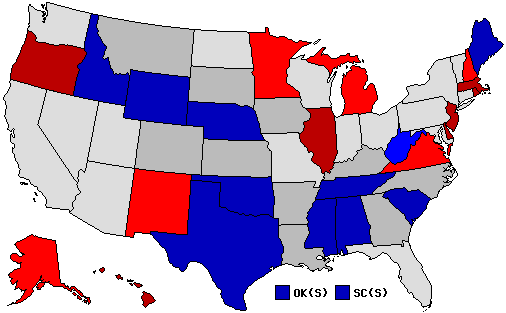
Confidence States Won
State Pick-ups
Predicted Senate Control (114th Congress):
Prediction Score (max Score = 72)
Analysis
1.Polls in Iowa, Colorado, and Georgia are tied.<br /> 2.Senator Pat Roberts of Kansas is highly unpopular now.
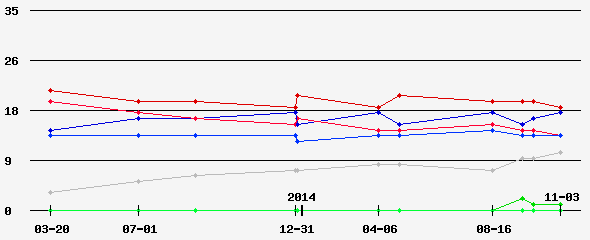
Prediction History
Comments History
- show
Version History User's Predictions
User Info
Links
|
|||||||||||||||||||||||||||||||||||||||||||||||||||||||||||||||||||||||||||||||||||||||||||||||||||||||||||||||||||||||||||||||||||||||||||||||||||||||||||||||||||||||||||||||||||||||||||||||||||||||||||||||||||||||||||||||||||||||||||||||||||||||||||||||||||||||||||||||||||||||||||||||||||||||||||||||||||||||||||||||||||||||||||||||||||||||||||||||||||||||||||||||||||||||||||||||||||||||||||||||||||||||||||||||||||||||||||||||||||||||||||||||||||||||||||||||||||
 2024 President
 2023 Governor
 2022 Senate
 2022 Governor
 2020 President
 2020 Senate
 2020 Governor
 2019 Governor
 2018 Senate
 2018 Governor
 2017 Governor
 2016 President
 2016 Senate
 2016 Governor
 2014 Senate
 2014 Governor
 2012 President
 2012 Senate
 2012 Governor
 2010 Senate
 2010 Governor
 2008 President
 2008 Senate
 2007 Governor
 2006 U.S. Senate
 2006 Governor
 2004 President


Back to 2014 Senatorial Prediction Home - Predictions Home
© Dave Leip's Atlas of U.S. Elections, LLC 2019 All Rights Reserved