2000 General Election Results Comparison - Virginia
| Map | Pie | Office | Total | D | R | I | Margin | %Margin | Dem | Rep | Ind | Oth. | Dem | Rep | Ind | Other |
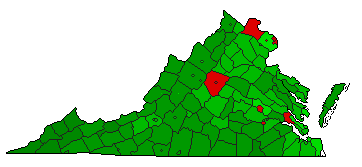
 |  | President | 2,739,447 | 2 | 1 | 3 | 220,200 | 8.04% | 44.44% | 52.47% | 2.17% | 0.92% | 1,217,290 | 1,437,490 | 59,398 | 25,269 |
 |  | Senator | 2,718,301 | 2 | 1 | 0 | 124,367 | 4.58% | 47.68% | 52.26% | 0.00% | 0.06% | 1,296,093 | 1,420,460 | 0 | 1,748 |
| Map | Pie | Initiative | Total Vote | N | Y | Margin | %Margin | No | Yes | Oth. | No | Yes | ||||
 | Referendum | 2,418,423 | 2 | 0 | 1 | 477,885 | 19.76% | 40.12% | 0.00% | 59.88% | 0.00% | 970,269 | 0 | 1,448,154 | 0 | |
Virginia Results for 2000
Login
© Dave Leip's Atlas of U.S. Elections, LLC 2019 All Rights Reserved
Note: The advertisement links below may advocate political positions that this site does not endorse.
Login
© Dave Leip's Atlas of U.S. Elections, LLC 2019 All Rights Reserved
Note: The advertisement links below may advocate political positions that this site does not endorse.