2018 General Election Results Comparison - Washington
| Map | Pie | Office | Total | D | R | I | Margin | %Margin | Dem | Rep | Ind | Oth. | Dem | Rep | Ind | Other |
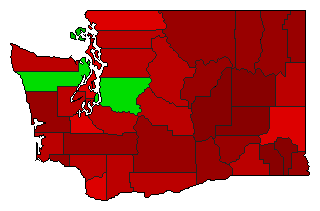
 |  | Senator | 3,086,168 | 1 | 2 | 0 | 520,560 | 16.87% | 58.43% | 41.57% | 0.00% | 0.00% | 1,803,364 | 1,282,804 | 0 | 0 |
| Map | Pie | Initiative | Total Vote | N | Y | Margin | %Margin | No | Yes | Oth. | No | Yes | ||||
 |  | Initiative | 3,086,428 | 1 | 0 | 2 | 404,978 | 13.12% | 56.56% | 0.00% | 43.44% | 0.00% | 1,745,703 | 0 | 1,340,725 | 0 |
Washington Results for 2018
Login
© Dave Leip's Atlas of U.S. Elections, LLC 2019 All Rights Reserved
Note: The advertisement links below may advocate political positions that this site does not endorse.
Login
© Dave Leip's Atlas of U.S. Elections, LLC 2019 All Rights Reserved
Note: The advertisement links below may advocate political positions that this site does not endorse.