2012 General Election Results Comparison - Wisconsin
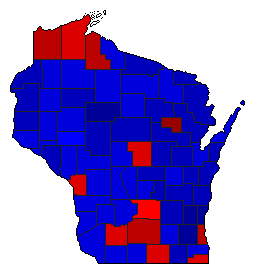
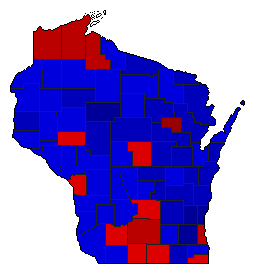
| Map | Pie | Office | Total | D | R | I | Margin | %Margin | Dem | Rep | Ind | Oth. | Dem | Rep | Ind | Other |
 |  | President | 3,068,434 | 1 | 2 | - | 213,019 | 6.94% | 52.83% | 45.89% | 0.00% | 1.29% | 1,620,985 | 1,407,966 | 0 | 39,483 |
 |  | Senator | 3,009,411 | 1 | 2 | 0 | 166,978 | 5.55% | 51.41% | 45.86% | 0.00% | 2.73% | 1,547,104 | 1,380,126 | 0 | 82,181 |
 | Governor | 2,516,065 | 2 | 1 | 0 | 171,105 | 6.80% | 46.28% | 53.08% | 0.00% | 0.64% | 1,164,480 | 1,335,585 | 0 | 16,000 | |
 | Lt. Governor | 2,461,336 | 2 | 1 | 0 | 145,219 | 5.90% | 46.99% | 52.89% | 0.00% | 0.13% | 1,156,520 | 1,301,739 | 0 | 3,077 |
Wisconsin Results for 2012
Login
© Dave Leip's Atlas of U.S. Elections, LLC 2019 All Rights Reserved
Note: The advertisement links below may advocate political positions that this site does not endorse.
Login
© Dave Leip's Atlas of U.S. Elections, LLC 2019 All Rights Reserved
Note: The advertisement links below may advocate political positions that this site does not endorse.