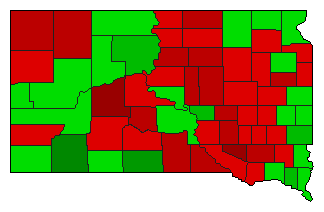
2020 General Election Results Comparison - South Dakota
| Map | Pie | Office | Total | D | R | I | Margin | %Margin | Dem | Rep | Ind | Oth. | Dem | Rep | Ind | Other |
 |  | President | 422,609 | 2 | 1 | 0 | 110,572 | 26.16% | 35.61% | 61.77% | 0.00% | 2.63% | 150,471 | 261,043 | 0 | 11,095 |
 |  | Senator | 420,219 | 2 | 1 | 0 | 132,245 | 31.47% | 34.26% | 65.74% | 0.00% | 0.00% | 143,987 | 276,232 | 0 | 0 |
 |  | US Representative | 397,732 | 0 | 1 | 0 | 246,236 | 61.91% | 0.00% | 80.96% | 0.00% | 19.04% | 0 | 321,984 | 0 | 75,748 |
| Map | Pie | Initiative | Total Vote | N | Y | Margin | %Margin | No | Yes | Oth. | No | Yes | ||||
 |  | Amendment | 415,737 | 2 | 0 | 1 | 34,783 | 8.37% | 45.82% | 0.00% | 54.18% | 0.00% | 190,477 | 0 | 225,260 | 0 |
South Dakota Results for 2020
Login
© Dave Leip's Atlas of U.S. Elections, LLC 2019 All Rights Reserved
Note: The advertisement links below may advocate political positions that this site does not endorse.
Login
© Dave Leip's Atlas of U.S. Elections, LLC 2019 All Rights Reserved
Note: The advertisement links below may advocate political positions that this site does not endorse.