1978 General Election Results Comparison - Alabama
| Map | Pie | Office | Total | D | R | I | Margin | %Margin | Dem | Rep | Ind | Oth. | Dem | Rep | Ind | Other |
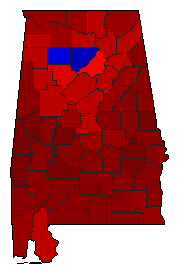 | Governor | 760,374 | 1 | 2 | 0 | 354,823 | 46.66% | 72.57% | 25.90% | 0.00% | 1.53% | 551,786 | 196,963 | 0 | 11,625 |
Alabama Results for 1978
Login
© Dave Leip's Atlas of U.S. Elections, LLC 2019 All Rights Reserved
Note: The advertisement links below may advocate political positions that this site does not endorse.
Login
© Dave Leip's Atlas of U.S. Elections, LLC 2019 All Rights Reserved
Note: The advertisement links below may advocate political positions that this site does not endorse.