2000 General Election Results Comparison - Alabama
| Map | Pie | Office | Total | D | R | I | Margin | %Margin | Dem | Rep | Ind | Oth. | Dem | Rep | Ind | Other |
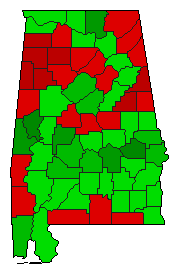
 |  | President | 1,672,551 | 2 | 1 | 3 | 248,807 | 14.88% | 41.59% | 56.47% | 1.10% | 0.85% | 695,602 | 944,409 | 18,349 | 14,191 |
| Map | Pie | Initiative | Total Vote | N | Y | Margin | %Margin | No | Yes | Oth. | No | Yes | ||||
 | Referendum | 1,347,658 | 2 | 0 | 1 | 255,792 | 18.98% | 40.51% | 0.00% | 59.49% | 0.00% | 545,933 | 0 | 801,725 | 0 | |
Alabama Results for 2000
Login
© Dave Leip's Atlas of U.S. Elections, LLC 2019 All Rights Reserved
Note: The advertisement links below may advocate political positions that this site does not endorse.
Login
© Dave Leip's Atlas of U.S. Elections, LLC 2019 All Rights Reserved
Note: The advertisement links below may advocate political positions that this site does not endorse.