1856 General Election Results Comparison - Illinois
| Map | Pie | Office | Total | D | R | I | Margin | %Margin | Dem | Rep | Ind | Oth. | Dem | Rep | Ind | Other |
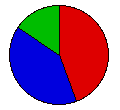 | President | 239,334 | 1 | 2 | 3 | 9,253 | 3.87% | 44.09% | 40.23% | 15.68% | 0.00% | 105,528 | 96,275 | 37,531 | 0 |
Illinois Results for 1856
Login
© Dave Leip's Atlas of U.S. Elections, LLC 2019 All Rights Reserved
Note: The advertisement links below may advocate political positions that this site does not endorse.
Login
© Dave Leip's Atlas of U.S. Elections, LLC 2019 All Rights Reserved
Note: The advertisement links below may advocate political positions that this site does not endorse.