1980 General Election Results Comparison - Illinois
| Map | Pie | Office | Total | D | R | I | Margin | %Margin | Dem | Rep | Ind | Oth. | Dem | Rep | Ind | Other |
 |  | President | 4,749,721 | 2 | 1 | 3 | 376,636 | 7.93% | 41.72% | 49.65% | 7.30% | 1.34% | 1,981,413 | 2,358,049 | 346,754 | 63,505 |
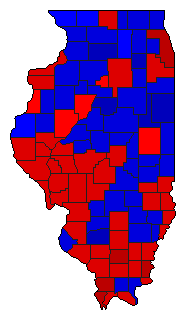 | Senator | 4,580,029 | 1 | 2 | 5 | 619,006 | 13.52% | 56.01% | 42.50% | 0.25% | 1.24% | 2,565,302 | 1,946,296 | 11,453 | 56,978 |
Illinois Results for 1980
Login
© Dave Leip's Atlas of U.S. Elections, LLC 2019 All Rights Reserved
Note: The advertisement links below may advocate political positions that this site does not endorse.
Login
© Dave Leip's Atlas of U.S. Elections, LLC 2019 All Rights Reserved
Note: The advertisement links below may advocate political positions that this site does not endorse.