1968 General Election Results Comparison - Indiana
| Map | Pie | Office | Total | D | R | I | Margin | %Margin | Dem | Rep | Ind | Oth. | Dem | Rep | Ind | Other |
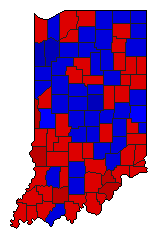
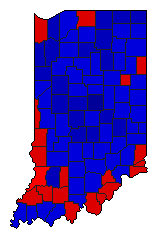
 |  | President | 2,123,597 | 2 | 1 | 3 | 261,226 | 12.30% | 37.99% | 50.29% | 11.45% | 0.28% | 806,659 | 1,067,885 | 243,108 | 5,945 |
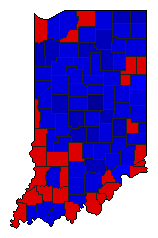
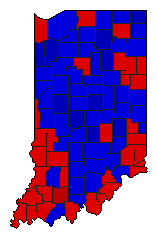
 |  | Senator | 2,053,118 | 1 | 2 | 3 | 71,885 | 3.50% | 51.65% | 48.15% | 0.14% | 0.06% | 1,060,456 | 988,571 | 2,844 | 1,247 |
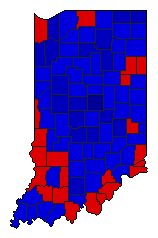
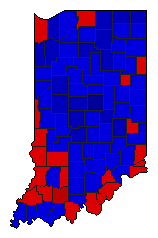
 |  | Governor | 2,049,072 | 2 | 1 | 3 | 114,455 | 5.59% | 47.13% | 52.72% | 0.15% | 0.00% | 965,816 | 1,080,271 | 2,985 | 0 |
 |  | Lt. Governor | 2,012,333 | 2 | 1 | 3 | 164,352 | 8.17% | 45.83% | 54.00% | 0.16% | 0.00% | 922,352 | 1,086,704 | 3,277 | 0 |
 |  | Secretary of State | 2,001,611 | 2 | 1 | 3 | 152,104 | 7.60% | 46.12% | 53.71% | 0.17% | 0.00% | 923,056 | 1,075,160 | 3,395 | 0 |
 |  | State Treasurer | 2,003,788 | 2 | 1 | 3 | 191,520 | 9.56% | 45.15% | 54.70% | 0.15% | 0.00% | 904,651 | 1,096,171 | 2,966 | 0 |
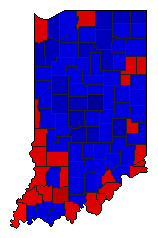
 |  | Attorney General | 2,006,757 | 2 | 1 | 0 | 79,361 | 3.95% | 48.02% | 51.98% | 0.00% | 0.00% | 963,698 | 1,043,059 | 0 | 0 |
 |  | State Auditor | 2,001,573 | 2 | 1 | 3 | 153,314 | 7.66% | 46.09% | 53.75% | 0.16% | 0.00% | 922,512 | 1,075,826 | 3,235 | 0 |
Indiana Results for 1968
Login
© Dave Leip's Atlas of U.S. Elections, LLC 2019 All Rights Reserved
Note: The advertisement links below may advocate political positions that this site does not endorse.
Login
© Dave Leip's Atlas of U.S. Elections, LLC 2019 All Rights Reserved
Note: The advertisement links below may advocate political positions that this site does not endorse.