1912 General Election Results Comparison - Kansas
| Map | Pie | Office | Total | D | R | I | Margin | %Margin | Dem | Rep | Ind | Oth. | Dem | Rep | Ind | Other |
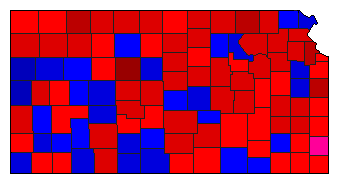
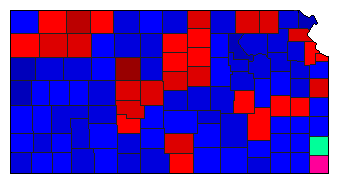
 |  | President | 365,560 | 1 | 3 | 2 | 23,453 | 6.42% | 39.30% | 20.47% | 32.88% | 7.34% | 143,663 | 74,845 | 120,210 | 26,842 |
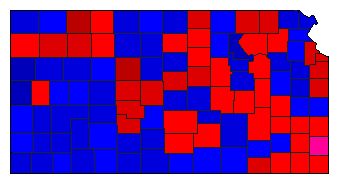
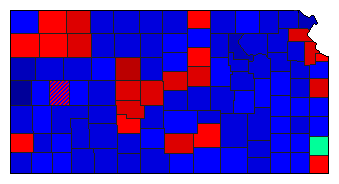
 |  | Senator | 350,033 | 1 | 2 | 3 | 20,954 | 5.99% | 49.31% | 43.32% | 7.32% | 0.05% | 172,601 | 151,647 | 25,610 | 175 |
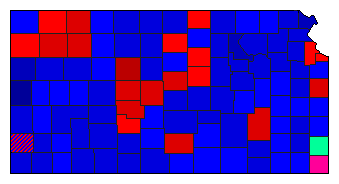
 |  | Governor | 359,682 | 1 | 2 | 0 | 29 | 0.01% | 46.55% | 46.54% | 0.00% | 6.91% | 167,437 | 167,408 | 0 | 24,837 |
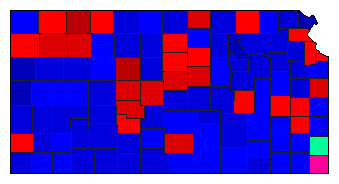
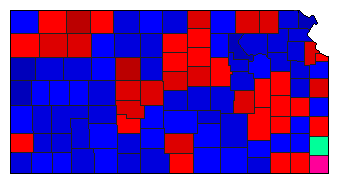 |  | Lt. Governor | 347,927 | 2 | 1 | 3 | 6,427 | 1.85% | 45.36% | 47.21% | 7.41% | 0.02% | 157,829 | 164,256 | 25,780 | 62 |
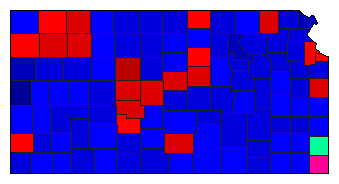 |  | Secretary of State | 346,748 | 2 | 1 | 3 | 19,577 | 5.65% | 43.42% | 49.06% | 7.49% | 0.03% | 150,552 | 170,129 | 25,973 | 94 |
 |  | State Treasurer | 346,772 | 2 | 1 | 3 | 8,375 | 2.42% | 45.06% | 47.48% | 7.46% | 0.00% | 156,257 | 164,632 | 25,883 | 0 |
 |  | Attorney General | 349,052 | 2 | 1 | 3 | 16,255 | 4.66% | 43.96% | 48.62% | 7.42% | 0.00% | 153,453 | 169,708 | 25,891 | 0 |
 |  | State Auditor | 345,855 | 2 | 1 | 3 | 19,173 | 5.54% | 43.46% | 49.01% | 7.53% | 0.00% | 150,314 | 169,487 | 26,054 | 0 |
 |  | Insurance Commissioner | 344,663 | 2 | 1 | 3 | 14,812 | 4.30% | 44.07% | 48.37% | 7.56% | 0.00% | 151,898 | 166,710 | 26,055 | 0 |
Kansas Results for 1912
Login
© Dave Leip's Atlas of U.S. Elections, LLC 2019 All Rights Reserved
Note: The advertisement links below may advocate political positions that this site does not endorse.
Login
© Dave Leip's Atlas of U.S. Elections, LLC 2019 All Rights Reserved
Note: The advertisement links below may advocate political positions that this site does not endorse.