1956 General Election Results Comparison - Massachusetts
| Map | Pie | Office | Total | D | R | I | Margin | %Margin | Dem | Rep | Ind | Oth. | Dem | Rep | Ind | Other |
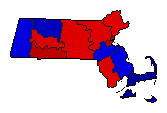
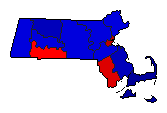
 |  | President | 2,348,506 | 2 | 1 | 0 | 445,007 | 18.95% | 40.37% | 59.32% | 0.00% | 0.30% | 948,190 | 1,393,197 | 0 | 7,119 |
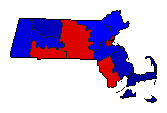
 | Governor | 2,339,868 | 1 | 2 | 3 | 137,859 | 5.89% | 52.76% | 46.87% | 0.25% | 0.12% | 1,234,618 | 1,096,759 | 5,799 | 2,692 | |
 | Lt. Governor | 2,261,997 | 1 | 2 | 4 | 76,591 | 3.39% | 51.22% | 47.84% | 0.35% | 0.59% | 1,158,704 | 1,082,113 | 7,894 | 13,286 | |
 | Secretary of State | 2,241,252 | 1 | 2 | 3 | 171,451 | 7.65% | 53.40% | 45.75% | 0.45% | 0.41% | 1,196,746 | 1,025,295 | 10,030 | 9,181 | |
 |  | State Treasurer | 2,256,295 | 1 | 2 | 4 | 152,814 | 6.77% | 53.03% | 46.26% | 0.35% | 0.35% | 1,196,626 | 1,043,812 | 7,887 | 7,970 |
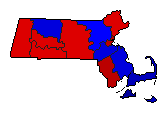
 |  | Attorney General | 2,278,215 | 2 | 1 | 3 | 39,243 | 1.72% | 48.86% | 50.58% | 0.35% | 0.21% | 1,113,105 | 1,152,348 | 7,983 | 4,779 |
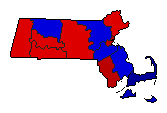
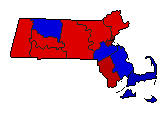 |  | State Auditor | 2,235,711 | 1 | 2 | 4 | 341,065 | 15.26% | 57.19% | 41.94% | 0.28% | 0.60% | 1,278,635 | 937,570 | 6,153 | 13,353 |
Massachusetts Results for 1956
Login
© Dave Leip's Atlas of U.S. Elections, LLC 2019 All Rights Reserved
Note: The advertisement links below may advocate political positions that this site does not endorse.
Login
© Dave Leip's Atlas of U.S. Elections, LLC 2019 All Rights Reserved
Note: The advertisement links below may advocate political positions that this site does not endorse.